20 February 2022: Database Analysis
The Obesity-Related Metabolic Gene HSD17B8 Protects Against Breast Cancer: High RNA/Protein Expression Means a Better Prognosis
Yunmeng Nie1ABEF, Fang Huang1B, Lihua Lou1B, Junbin Yan1ABCDEF*DOI: 10.12659/MSM.934424
Med Sci Monit 2022; 28:e934424


Abstract
BACKGROUND: The incidence of breast cancer is increasing annually. Obesity and metabolism are considered risk factors for breast cancer. Discovery of obesity- and metabolism-related breast cancer prognostic genes is imminent.
MATERIAL AND METHODS: We screened metabolism-related genes (MRG) from KEGG and downloaded the obese female dataset GSE151839 from GEO, which screened differentially-expressed genes (DEGs), seen as female obesity-related genes. The intersection of MRGs and DEGs was obesity-related metabolic genes (OMGs), verified by enrichment analysis. After downloading breast cancer data from TCGA, univariate Cox regression and log-rank P analyses were used to screen hub OMGs related to breast cancer prognosis. ROC curve and Kaplan-Meier (KM) plotter, GEPIA, and GENT2 databases were used to verify the hub OMGs at the RNA level. CPTAC and HLA databases were used to verify the hub OMGs at the protein level.
RESULTS: We screened 33 OMGs. The results of univariate Cox regression and log-rank P analysis showed 3 of 33 OMGs (ABCA1, LPIN1, HSD17B8) were associated with the prognosis of breast cancer patients. After verification with ROC, KM-plotter, and GEPIA, only HSD17B8 was related to breast cancer prognosis (overall/disease-free survival). Results of GENT2 showed the RNA expression of HSD17B8 in breast cancer subtypes with poor prognosis is significantly lower than that with good prognosis. Results of CPTAC and HLA databases showed that the protein expression level of HSD17B8 in breast cancer tissues was significantly lower than that in adjacent normal tissues.
CONCLUSIONS: HSD17B8 is a protective gene against breast cancer. The higher the expression of HSD17B8, the better the prognosis of breast cancer patients.
Keywords: Biomarkers, Tumor, Breast Neoplasms, HSD17B8 Protein, Human, overweight, Computational Biology, Databases, Genetic, Female, Gene Expression Profiling, Genes, MHC Class I, Humans, Obesity, Oxidoreductases, Protein Interaction Maps, Proteins, Proteomics, ROC Curve
Background
Currently, breast cancer is the most common cancer worldwide and a significant cause of cancer death in females [1]. Breast cancer has also become the most common newly diagnosed cancer, with 2.3 million diagnosed pathologies in 2020 (11.7%) [2]. The incidence of breast cancer is increasing annually and the fatality rate remains high, reminding us to pay attention to the risk factors of breast cancer.
Recent studies have demonstrated that obesity (body mass index, BMI>30 kg/m2) is associated with higher risks of breast cancer [3,4]. Obesity dramatically increases the risk of death for breast cancer patients (35% to 40%) and the rate of metastasis [5,6]. A cohort study even directly confirmed that obese females (BMI >31.1 kg/m2) have a relative risk (RR) of breast cancer of 2.5 (95% CI, 1.6–3.3) compared with females with BMI <22.6 kg/m2 [7].
Adipokines, biologically active hormones produced and secreted by adipose tissue, have multiple functions, including regulating metabolism, angiogenesis, and cell proliferation [8]. Adipokines may act as the bridge between obesity and breast cancer. Leptin, a crucial and common adipokine involved in regulating energy balance, whose level will elevate with the increase of BMI [9]. Dieudonne et al found that high leptin level promotes the proliferation of MCF-7 cells (human breast cancer cells) through STAT3 and p42/p44 MAP kinase pathways [10]. Obese females always accompany abnormal hormone levels. High levels of circulating estrogen have been seen as the culprit for the high incidence of hormone-sensitive breast cancer, representing approximately 70% of all breast cancers [11,12]. In addition, there is a close relationship between obesity and metabolism. An increasing number of studies have confirmed the combined effects of obesity and metabolism on the onset of breast cancer [13]. The abnormal metabolism of obese patients can cause the proliferation and hypertrophy of adipocytes and metaflammation [14]. The latter is one of the most common risk factors for breast cancer. It is critical to achieve early diagnosis and improve the prognosis of breast cancer patients by screening obesity-related prognostic genes.
Therefore, we screened metabolism-related genes (MRGs) from the Kyoto Encyclopedia of Genes and Genomes (KEGG) database and literature in this study. Differentially-expressed genes (DEGs), also referred to as female obesity-related genes, were chosen from GSE151839, a gene set of obese females downloaded from the Gene Expression Omnibus (GEO) database. Genes at the intersection of the MRG and DEGs were regarded as obesity-related metabolic genes (OMGs) and were used for follow-up analysis. Next, we downloaded the TCGA-BRCA dataset from The Cancer Genome Atlas (TCGA) database and searched the expression of OMGs and clinical data. Univariate Cox regression and log-rank
Material and Methods
PUBLIC DATABASES AND SOFTWARE USED IN THE STUDY:
The public databases, datasets, and software used in the study are displayed in Table 1.
SCREENING OF OBESITY-RELATED METABOLIC GENES:
We searched for metabolic pathways in the KEGG database, and processed the genes (Species: Homo sapiens) in the pathways as MRGs based on the literature.
We downloaded the obese females dataset GSE151839 from the Gene Expression Omnibus (GEO) database. Box plots and principal component analysis (PCA) plots were drawn to clarify whether the expression data were standardized and whether there were differences between the obesity and normal groups.
Genes at the intersection of MRGs and DEGs were regarded as metabolic genes related to obese females, which are called OMGs and were used for subsequent analysis. Gene Ontology (GO) enrichment and Kyoto Encyclopedia of Genes and Genomes (KEGG) enrichment analyses were performed on the upregulated and downregulated OMGs to determine whether the functions of the selected genes are related to metabolism.
SCREENING OF OMGS RELATED TO BREAST CANCER PROGNOSIS:
We downloaded female breast cancer expression data (TCGA-BRCA) from the TCGA database, and performed log2 (exp+1) and standardization processing. Then, we screened the expression of OMGs and drew a PCA chart that was used to determine whether there was a difference between normal paracancerous samples and breast cancer samples.
Univariate Cox regression analysis was based on the expression of OMGs to screen the prognosis-related genes (PRG) of breast cancer patients (
Breast cancer patients were next divided into high- and low-expression groups according to the expression of OMGs (high-expression group: gene expression greater than the median expression; low-expression group: less than or equal to the median expression). Batch survival analysis of OMGs was calculated by log-rank
Univariate Cox regression and log-rank
VERIFICATION THE ACCURACY ANALYSIS RESULTS AND SECONDARY SCREENING:
DeLong’s test and receiver operating characteristic (ROC) curves were used to verify the accuracy of selected hub OMGs in predicting the OS of breast cancer patients and determine whether the selected genes have potential as breast cancer biomarkers.
The Kaplan-Meier plotter database, including the data of 1879 breast cancer patients with survival information, was used to draw Kaplan-Meier survival curves to assess whether the chosen hub OMGs are related to the OS of breast cancer patients.
In addition, to enhance the credibility of verification, the GEPIA database was used to draw the OS curves and disease-free survival (DFS) curves of the hub OMGs. DFS refers to the time from randomization to disease recurrence or patient death due to disease progression, and also was used to determine the prognosis of cancer patients.
VERIFICATION OF THE RELATIONSHIP OF HUB OMGS RNA EXPRESSION AND BREAST CANCER SUBTYPES PROGNOSIS:
We used GENT2, a database that provides options to research the differential expression and its prognostic significance based on tumor subtypes, to verify the expression of the chosen relationship of hub OMGs and breast cancer subtypes.
We first assessed whether there was a difference in the expression of the hub OMGs between breast cancer tissues and normal breast tissues, then we determined whether there were differences in the expression of the hub OMGs between different breast cancer subtypes. Finally, we explored whether differences in the expression of the above OMGs are related to breast cancer prognosis.
VERIFICATION OF THE RELATIONSHIP OF HUB OMGS PROTEIN EXPRESSION AND BREAST CANCER:
RNA verification for hub OMGs has been performed before, and to increase the accuracy of the results, confirmation at the protein level was carried out.
The immunochemical staining results of hub OMGs were extracted from the HLA database to clarify the location and expression of the selected hub OMGs in breast tissue.
In addition, we downloaded the protein expression of hub OMGs in the breast cancer tissues and adjacent normal tissues of breast cancer patients from the CPTAC database. Hub OMGs protein expression was compared between the normal breast tissue and breast cancer tissues to increase the credibility of the verification results.
THE RELATIONSHIP BETWEEN CLINICAL CHARACTERISTICS AND HUB OMGS:
The breast cancer patients in the TCGA-BRCA dataset were grouped according to the stage, age, and progesterone receptor (PR). The stage group was divided into I, II, III, and IV. The age group was split into youth (<45), middle-aged (45–60), and elderly (>60). PR was divided into negative and positive groups. We sought to determine whether the expression of hub OMGs was significantly different in the above groups.
STATISTICAL ANALYSIS:
The Wilcoxon test and Kruskal-Wallis test were used to screen for differential expression between groups. Univariate Cox regression analysis and log-rank
Results
RESULTS OF MRGS SCREENING:
We chose 5 metabolic pathways in the KEGG database and combined some literature for screening MRGs. The number of MRGs examined from each path was as follows: Galactose metabolism (map00052), 31; Glycerolipid metabolism (map00561), 58; Cholesterol metabolism (map04979), 49; Fructose and mannose metabolism (map00051), 33; and Fatty acid metabolism (map01212), 55. After removal of 15 duplicated genes, a total of 211 MRGs were screened out (
RESULTS OF DEGS SCREENING:
The GSE151839 dataset includes 40 samples from the skin and fat biopsies of 20 subjects (10 obese humans, 10 normal humans). We secondarily divided the dataset into fat (10 fat obese and 10 controls) and skin groups (10 skin obese and 10 controls) and separately screened for DEGs. Expression data were standardized (Supplementary Figure 1A). The PCA chart shows a difference between the obese and normal controls (Supplementary Figure 1B). Supplementary Figure 1 shows that the sequencing data of the GSE151839 dataset has been preprocessed, and there was a significant difference in gene expression between normal and obese samples, which was further analyzed. We finally found that 1132 genes in the fat group were upregulated in obese females and 573 were downregulated; in the skin group, 163 genes were upregulated in obese females compared with normal samples, and 737 genes were downregulated. MMP9, SPP1, EGFL6/CORIN, PRG4, and S100A7A were the 5 most upregulated genes in the fat/skin group. SLC27A2, RORB, SPX/CRISP3, AQP5, and HLA-DQA1 were the top 5 downregulated genes in the fat/skin group (Figure 2). Then, we united the upregulated DEGs and downregulated DEGs of skin and fat groups for follow-up analysis. The summary results showed that a total of 1261 genes were upregulated in obese females and 1244 genes were downregulated (Figure 3A 3B).Supplementary Table 2 provides full information on DEGs.
RESULTS OF OMGS SCREENING:
MRGs and DEGs had 33 overlapping genes (Figure 3C, 3D), which were regarded as OMGs. Among them, 9 OMGs were upregulated in obese females and 24 OMGs were downregulated (Table 2).
The results of GO enrichment analysis showed that the gene function of the upregulated OMGs was mainly related to triglyceride metabolism and the function of the downregulated OMGs was primarily associated with the metabolism of fatty acids (Figure 4A). The results of KEGG enrichment analysis indicated the signaling pathways most related to the OMGs were Glycerolipid metabolism, Cholesterol metabolism, Fatty acid metabolism, and Fructose and mannose metabolism, all of which are associated with metabolism (Figure 4B). The enrichment results all suggested the 33 OMGs previously screened were indeed genes related to metabolism, and the screening results were reliable.
RESULTS OF SCREENING BREAST CANCER PROGNOSIS-RELATED OMGS:
In TCGA-BRCA dataset, there were 112 normal paracancerous samples and 1096 tumor (breast cancer) samples. The PCA chart showed noticeable component differences between normal paracancerous tissues and breast cancer tissues, suggesting significant differences in gene expression between the 2 types of tissues (Supplementary Figure 2).
Further screening of the clinical data of breast cancer patients showed that 1018 samples out of 1096 tumor samples had corresponding clinical information (Supplementary Table 3). Among them, there were 915 patients alive and 103 patients died. Next, the patients were grouped according to the median age of 58 years old: those age ≤58 years were assigned to the young group (n=517) and those age >58 years were assigned to the older group (n=501). The average age of the above sample was 58 years. We also sorted out the data of patients with PR (positive/negative) and tumor stages (I/II/III/IV). Kaplan-Meier plotting showed that the OS of breast cancer patients was influenced by age, stage, and PR. Older age, more severe cancer stages, and being PR-negative were associated with worse prognosis of breast cancer patients (Figure 5A–5C).
Univariate Cox regression analysis showed that in the 33 OMGs only 15 genes were related to breast cancer prognosis (P<0.05) (Figure 6A). A total of 11 OMGs (ABCA1, AGPAT2, APOB, CETP, DGAT1, ELOVL3, GPAT3, HADH, LPIN1, MOGAT1, and PFKFB1) were risk genes for breast cancer (hazard ratio, HR>1); the higher expression of the above genes, the worse the prognosis of breast cancer patients. APOE, GK, HSD17B8, and PLPP4 were the protective genes of breast cancer (HR<1) (Table 3).
The results of log-rank P test showed ABCA1, LPIN1, ACACA, and HSD17B8 are related to the OS of breast cancer patients (P <0.05) (Table 4). ABCA1, LPIN1, and HSD17B8 were intersection genes of 15 PRGs and 4 SRGs (Figure 6B, 6C). The patients with low expression of ABCA1 and LPIN1 had longer survival times and better survival status. On the contrary, breast cancer patients with high expression of HSD17B8 had better OS. Therefore, we propose a preliminary hypothesis: obesity-related metabolic genes ABCA1, LPIN1, HSD17B8 may be the hub OMGs for breast cancer patients. Corresponding verifications were needed.
RESULTS OF VERIFICATIONS FROM RNA LEVEL:
Through DeLong’s test, we found that in predicting the survival outcome of breast cancer patients, HSD17B8 had better diagnostic power than LPIN1 (P<0.01) and ABCA1 (P<0.001); LPIN1 had better diagnostic power than ABCA1, but the results were not statistically significant (P>0.05). The range of area under the ROC curve (AUC) was between 0.5 and 1. AUC values closer to 1 indicated higher accuracy of the detection method; the closer to 0.5, the lower the accuracy and the lower the application value. Supplementary Figure 3 shows that in the above genes, only HSD17B8 had an AUC value greater than 0.6, indicating that the expression of HSD17B8 may be useful in predicting the prognosis of breast cancer patients (death/alive) and has potential as a breast cancer prognosis biomarker.
KM-plotter database verification results showed that only the expression of HSD17B8 was related to the OS of breast cancer patients (P<0.05); the higher the expression of HSD17B8, the better the prognosis (Figure 7).
The GEPIA database also showed that only the expression of HSD17B8 was correlated with the OS and DFS of breast cancer patients (P<0.05). In addition, HR was less than 1, which further confirmed that HSD17B8 is a breast cancer protective gene (Figure 8).
The results of the GENT2 database showed that the expression of HSD17B8 in breast cancer tissues was significantly lower than that of normal tissues (P<0.001) (Figure 9A). The expression of HSD17B8 also differed significantly among different breast cancer subtypes. In subtypes with worse prognoses, the expression of HSD17B8 was lower. Compared with patients with luminal breast cancer, which has a better prognosis, the expression of HSD17B8 in patients with poor prognoses, such as basal, HER2, and triple-negative breast cancer (TNBC), was significantly reduced (P<0.001) (Figure 9B).
RESULTS OF VERIFICATIONS FROM PROTEIN LEVEL:
The results of immunochemical staining showed that the expression of HSD17B8 in normal tissues was higher than that in lobular breast cancer and ductal breast cancer tissues. Moreover, HSD17B8 was highly expressed in glandular cells, myoepithelial cells of normal tissues, but had almost no expression in adipocytes (Figure 10A–10C).
Downloading the HSD17B8 protein expression levels of breast cancer patients from the CPTAC database showed a total of 133 tumor samples and 18 adjacent normal samples (from 125 breast cancer patients, among them, 18 breast cancer patients provided normal adjacent tissue). The difference in the expression of HSD17B8 between normal adjoining breast tissues and breast cancer tissues was compared. The results showed that in normal adjacent tissues, the protein expression of HSD17B8 was much higher than that in breast cancer tissues (P <0.001) (Figure 10D).
CORRELATIONS BETWEEN CLINICAL CHARACTERISTICS AND HSD17B8:
The TCGA-BRCA dataset has a total of 1018 breast cancer patients’ age information, which were divided into the youth group (n=150), the middle-aged group (n=417), and the elderly group (n=451). Excluding 22 patients without stage information, the remaining 996 patients were divided into stages I (n=177), II (n=566), III (n=234), and IV (n=19). Among 1018 breast cancer patients, 43 patients with unknown PR status were excluded, leaving 975 patients. These 975 patients were divided into the PR-positive group (n=650) and PR-negative group (n=325) (Table 5). The Kruskal-Wallis test was used to assess differences in expression of HSD17B8 among age and cancer stage groups. The Wilcoxon test was used to detect differences in the expression of HSD17B8 between the PR-negative group and PR-positive group. The analysis results showed that the expression of HSD17B8 in the elderly group was significantly higher than that in the middle-aged group (P<0.05), but there were no significant differences among the other age groups. We found no significant difference in the expression of HSD17B8 among the cancer-stage groups. In the PR groups, we found that the expression of HSD17B8 in the PR-positive group was significantly higher than that in the PR-negative group (P<0.001) (Figure 11). We found that the HSD17B8 gene protects against breast cancer. Higher HSD17B8 RNA/protein expression was associated with better prognosis of breast cancer patients. High expression of HSD17B8 may be the reason why PR-positive breast cancer patients had a better prognosis than PR-negative patients.
Discussion
Systemic treatment of breast cancer has mainly consisted of chemotherapy, immunotherapy, and targeted therapy, but some corresponding adverse effects or other disadvantages are inevitable.
Because of the high sensitivity of breast cancer cells to chemotherapy drugs, chemotherapy has become an important tool at all stages of breast cancer. Capecitabine, a chemotherapeutic drug most commonly used clinically, can significantly improve the OS and DFS of breast cancer patients [29]. However, chemotherapy is prone to drug resistance and severe adverse reactions. Long-term use of Capecitabine greatly increases the prevalence of grade 3/4 diarrhea and hand-foot syndrome [30]. Programmed death-1 (PD-1) and programmed death-ligand 1 (PD-L1) inhibitors are well-known drugs (combined with PD-1/PD-L1) in immunotherapy that can promote T lymphocytes to recognize and kill tumor cells and reduce the immune escape ability of cancer cells [31]. PD-1/PD-L1 immunotherapy has few adverse effects but has more significant limitations. Since breast cancer is classified as a non-immunogenic tumor, not all breast cancer subtypes are suitable for immunotherapy.
Normal cells and tumor cells differ in expression of many genes, and these differences can be used as targets. Targeted therapy uses molecularly targeted drugs to regulate these targets and block the signal transduction of tumor cells, thereby inhibiting or killing tumor cells. The cyclin-dependent kinase 4 and 6 (CDK4/6) inhibitor Palbociclib (PD0332991) can inhibit CDK4/6 activity, blocking tumor cell proliferation [32]. Many clinical trials have confirmed that the use of Palbociclib can significantly improve the OS of breast cancer patients [33,34]. Targeted therapy has received increasing attention for its advantages of few adverse effects and strong efficacy. The focus of research on targeted therapy development has been to find target genes related to the onset, treatment, and prognosis of cancer and to develop drugs targeting specific genes.
In the present study, we used the data of public databases GEO and TCGA to preliminarily screen out the 3 obesity-related metabolic genes (ABCA1, LPIN1, and HSD17B8) related to the prognosis of breast cancer patients, but only HSD17B8 has passed the secondary verifications. HSD17B8 is associated with the prognosis of breast cancer patients and it is also a protective gene. The higher the RNA/protein expression of HSD17B8 in breast cancer patients, the better the prognosis. The expression of HSD17B8 in breast cancer subtypes with poor prognoses, such as TNBC, basal-like breast cancer (BLBC), and HER2 breast cancer, were all significantly lower than those with better prognosis, such as Luminal A and Luminal B breast cancer. We also found that the expression of HSD17B8 in the progesterone receptor (PR)-positive group was significantly higher than that in the negative group. The increased expression of HSD17B8 means a better prognosis, suggesting that PR-positive breast cancer patients tend to have a better prognosis. In clinical practice, the prognosis of PR-positive breast cancer patients is indeed better than that of PR-negative patients, suggesting that high expression of HSD17B8 is one of the reasons PR-positive patients tend to have a better prognosis.
Obesity is closely related to abnormal fatty acid synthesis. Cells contain 2 fatty acid synthesis systems, one in the cytoplasm (catalyzed by fatty acid synthase) and the other in the mitochondria (mitochondrial fatty acid synthesis [mtFAS]) [35]. HSD17B8 is the crucial enzyme in the mtFAS pathway [36]. Zeng et al found that compared with normal mice, the expression of HSD17B8 in the liver and muscle of obese mice was significantly different, which can result in abnormal mtFAS. Extensive targeted lipidomics analysis has been used to reveal that lipid changes in mtFAS-deficient cells is manifested as an accumulation of triglycerides, which causes obesity [37]. Therefore, undoubtedly, HSD17B8 is the gene related to obesity.
Additionally, HSD17B8, a metabolic gene and the isomer of the HSD17B enzyme, regulates the concentration of biologically active estrogens and androgens. Estrogen is a critical risk factor for breast cancer [38]. Excessive levels of estrogens, coupled with continuous stimulation of the breast epithelium, change the endocrine environment and metabolism, leading to malignant changes in breast cells and inducing breast cancer [39,40]. Estrogens drive the occurrence of approximately 80% of all breast cancers. Androgens have always been considered as “developmental arrest” signals of breast cancer development [41]. Therefore, androgens can be used to treat breast cancer or patients who are resistant to estrogens-related endocrine therapy. The latest research has confirmed androgens agonists are more effective in improving the prognosis of breast cancer patients than are existing breast cancer treatment drugs such as tamoxifen. In addition, androgens agonists can be combined with Pabocinil to enhance breast cancer treatment efficacy [42]. Therefore, HSD17B8, which regulates the concentration of estrogens and androgens, may be a gene related to breast cancer and may also be a potential target for targeted therapy. Many scholars have also found that estrogen receptors (ERs) promote the expression of estrogen target genes, leading to the occurrence and development of estrogen-stimulated breast cancer. Almost 70% of breast cancer patients are estrogen receptor (ER)-positive. Clinically, ERs antagonists (such as tamoxifen) are often used as an effective therapy for breast cancer [43]. However, in the present study, we did not clarify whether there is an interaction between HSD17B8 and ERs, so more in-depth research is necessary.
17-β-Hydroxysteroid dehydrogenase type 1 (HSD17B1), which is also the isomer of HSD17B enzyme, is responsible for the production of estradiol (E2), the most potent estrogen in women, and 5-androstane-3β,17β-diol (5-diol), which has an essential role after menopause [44]. Undoubtedly HSD17B1 is a treatment target for estrogen-dependent diseases such as breast cancer. In addition, in a population-based case-control study, Collin et al found that HSD17B1 and 17 beta-hydroxysteroid dehydrogenase type 2 (HSD17B2) are both related to the recurrence of breast cancer [45]. Breast cancer patients with increased HSD17B1 expression, without a corresponding increasing expression of HSD17B2, may develop resistance to tamoxifen treatment by producing higher local concentrations of E2, which compete with tamoxifen for binding to the ERs. Through homology modeling and docking studies, Cortés-Benítez et al found that regulating the expression of 17 beta-hydroxysteroid dehydrogenase type 3 (HSD17B3) helps to improve the metabolic stability and cytotoxicity of breast cancer cells [46]. 17 beta-hydroxysteroid dehydrogenase type 7 (HSD17B7) has also been proven to be a therapeutic target for breast cancer [47,48]. The above HSD17B enzyme isomers both are seen as breast cancer therapeutic targets, further supporting that HSD17B8, which is also an enzyme isoform of HSD17B, may also become a new breast cancer treatment target.
The present study provides a reference for the follow-up study of breast cancer with metabolism and obesity. Although we only used data from public databases for analysis, the analyzed data were selected from multiple databases. The results have passed various verifications, which guarantees a high level of reliability of the results. In addition, mining the published data again and obtaining valuable information from it also enables the data to be used twice, which increases the value of the data. The lack of in vivo/in vitro verification is a limitation of the present study, but we firmly believe that the screening results of the study are reliable, and subsequent experiments are in progress.
Conclusions
(1) As an obesity-related metabolic gene, HSD17B8 can accurately predict breast cancer patient prognosis. (2) HSD17B8 protects against breast cancer. The higher the RNA/protein expression of HSD17B8, the better the prognosis of breast cancer patients.
Figures
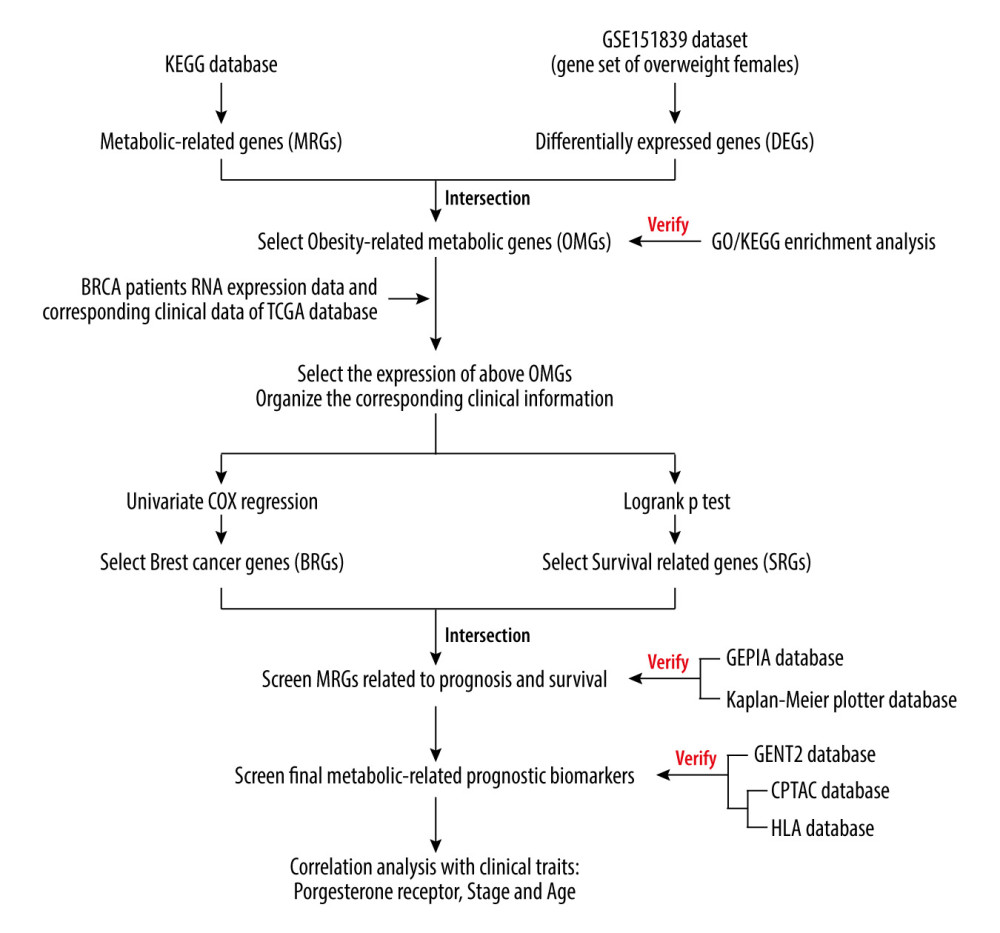 Figure 1. The analysis flow chart of the study.
 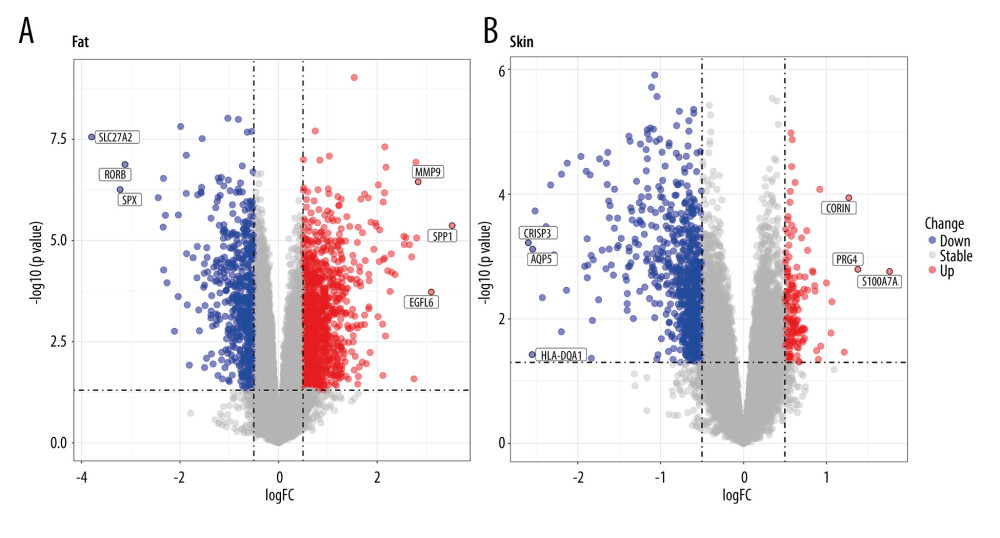 Figure 2. Volcano plots of GSE151839. (A) DEGs of Fat group. (B) DEGs of Skin group.
 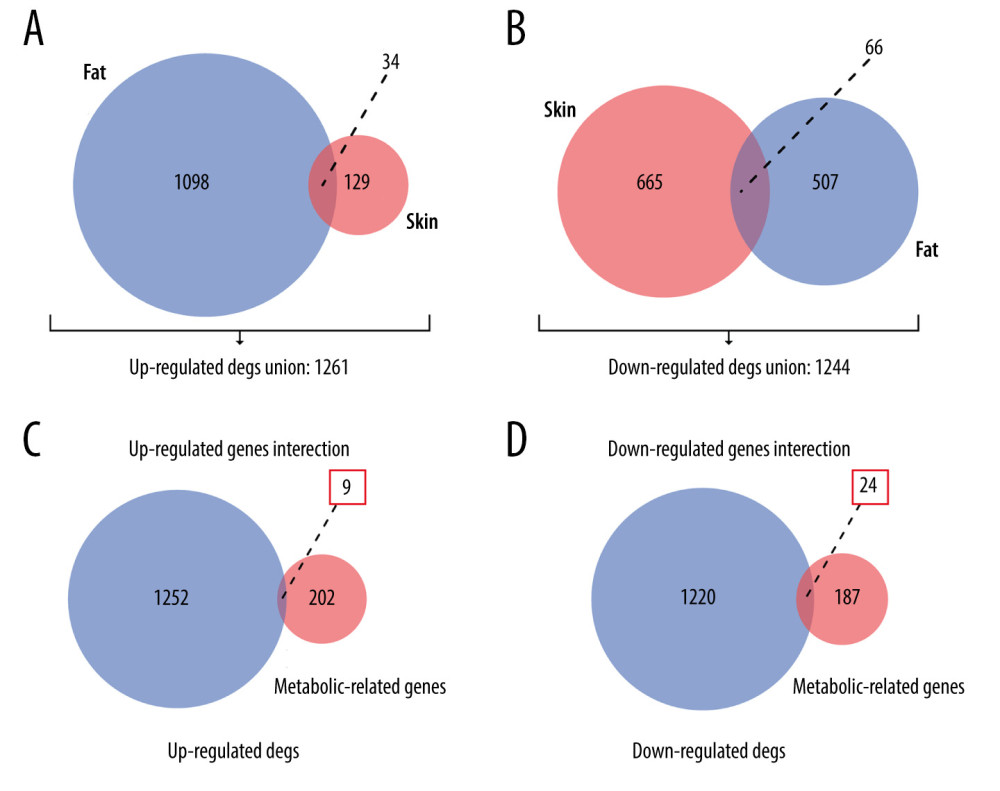 Figure 3. Venn plots of union DEGs/intersection OMGs. (A) The union of upregulated DEGs. (B) The union of downregulated DEGs. (C) The upregulated OMGs. (D) The downregulated OMGs.
 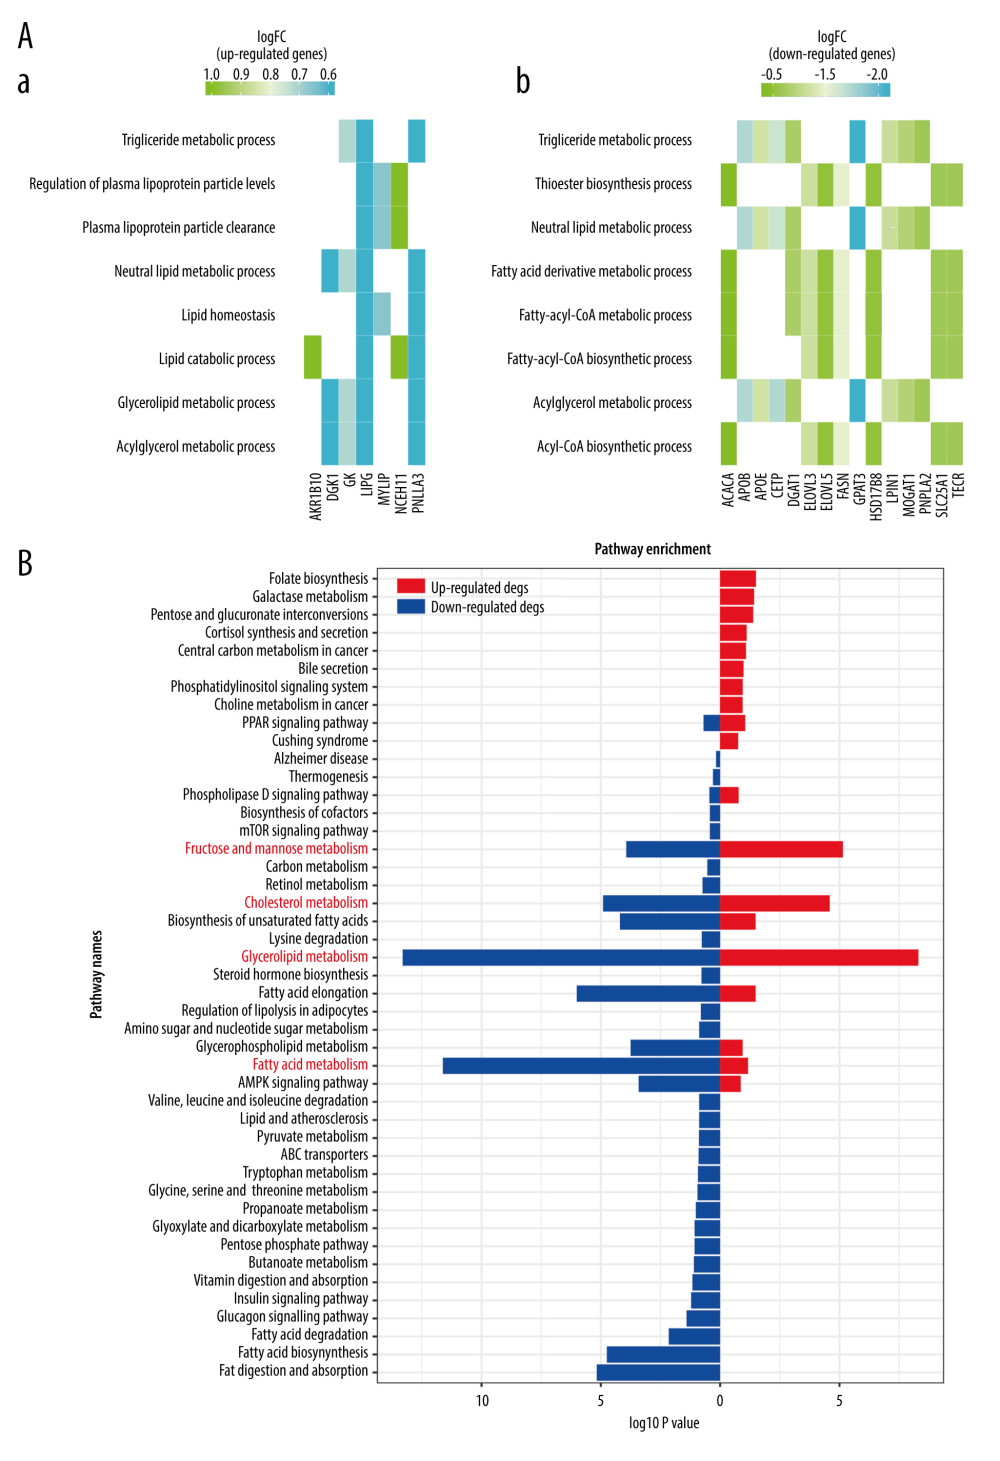 Figure 4. The enrichment analysis results. (A) Go enrichment results of OMGs. (B) KEGG enrichment results of OMGs.
 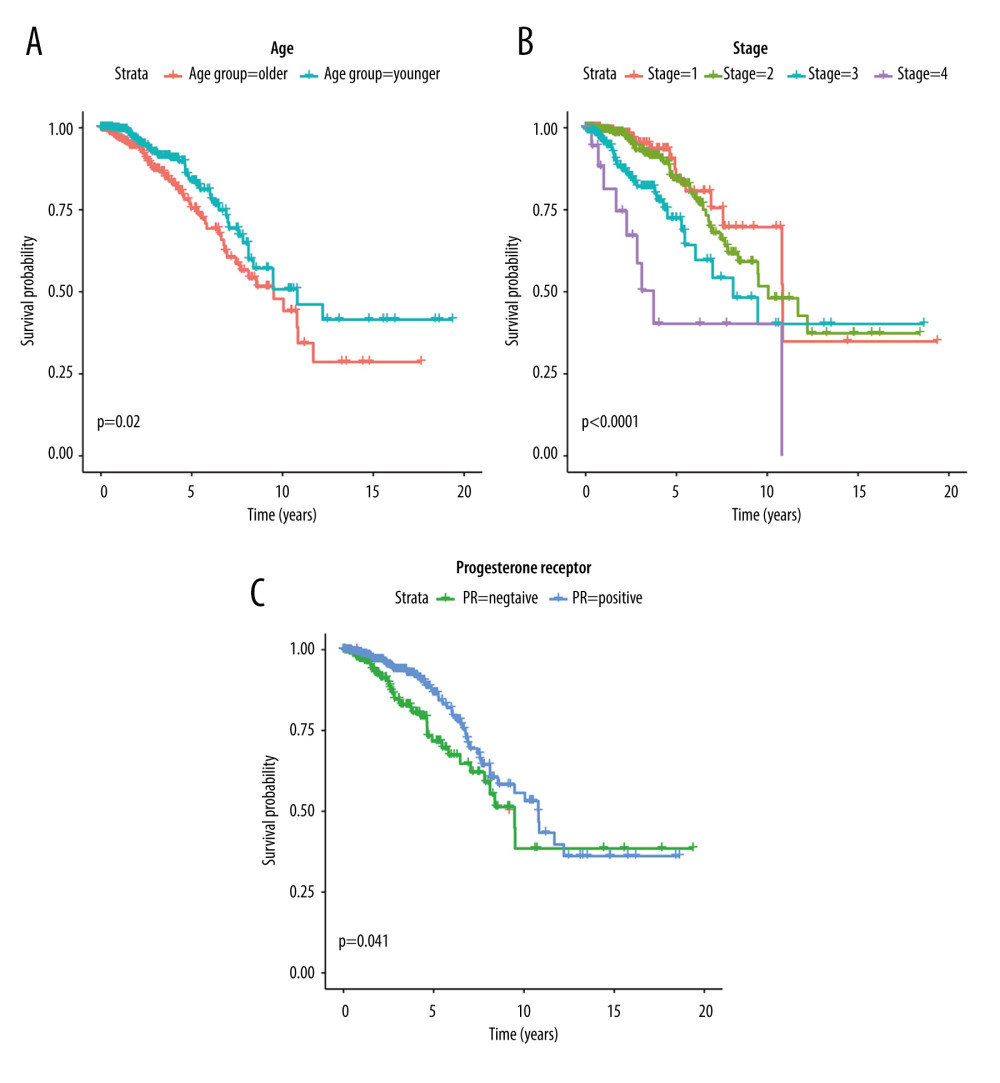 Figure 5. Kaplan-Meier survival curves of clinic traits. (A) The Kaplan-Meier survival curve of OS and age. (B) The Kaplan-Meier survival curve of OS and stage. (C) The Kaplan-Meier survival curve of OS and progesterone receptor.
 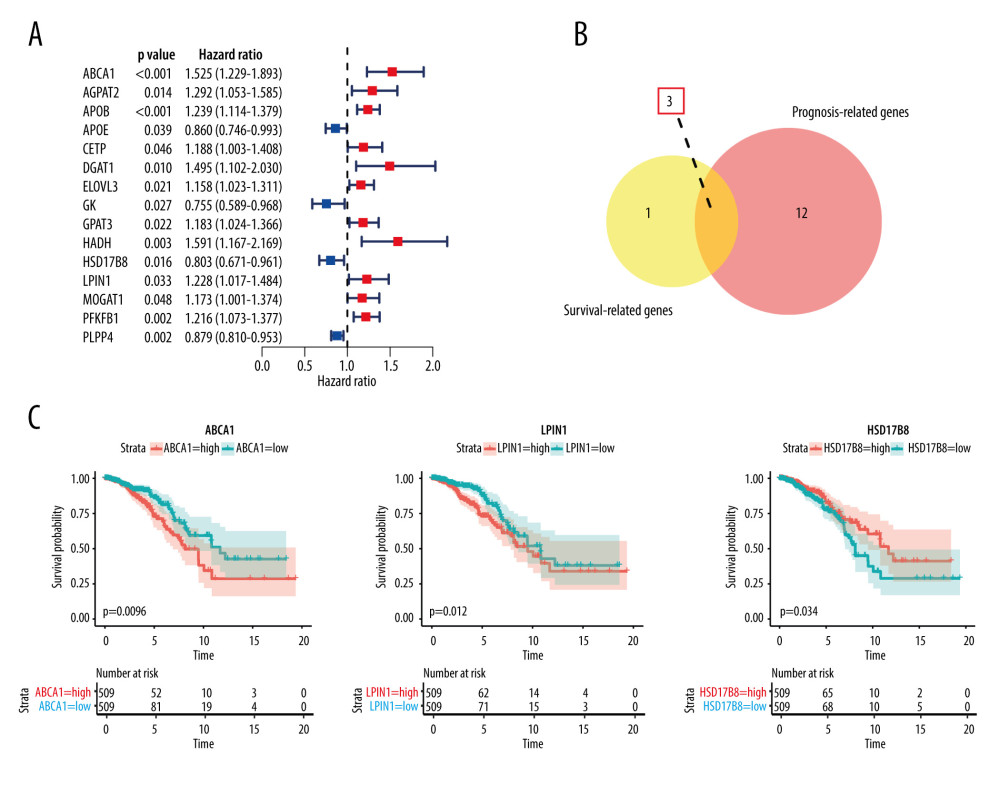 Figure 6. Results of hub OMGs screening. (A) The results of univariate Cox regression analysis. (B) The results of intersection genes. (C) The Kaplan-Meier survival curve of OS and hub OMGs expression.
 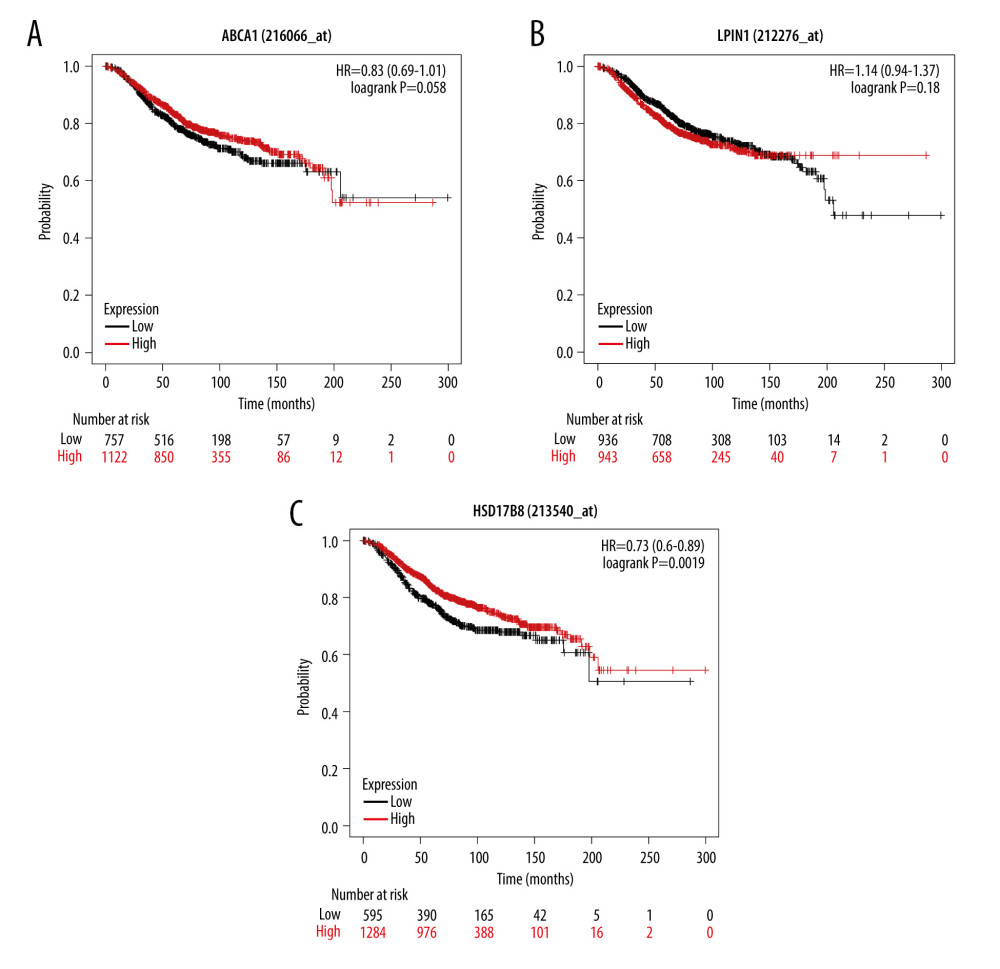 Figure 7. The verification results of Kaplan-Meier plotter database. (A) The Kaplan-Meier survival curve of OS and ABCA1 expression. (B) The Kaplan-Meier survival curve of OS and LPIN1 expression. (C) The Kaplan-Meier survival curve of OS and HSD17B8 expression.
 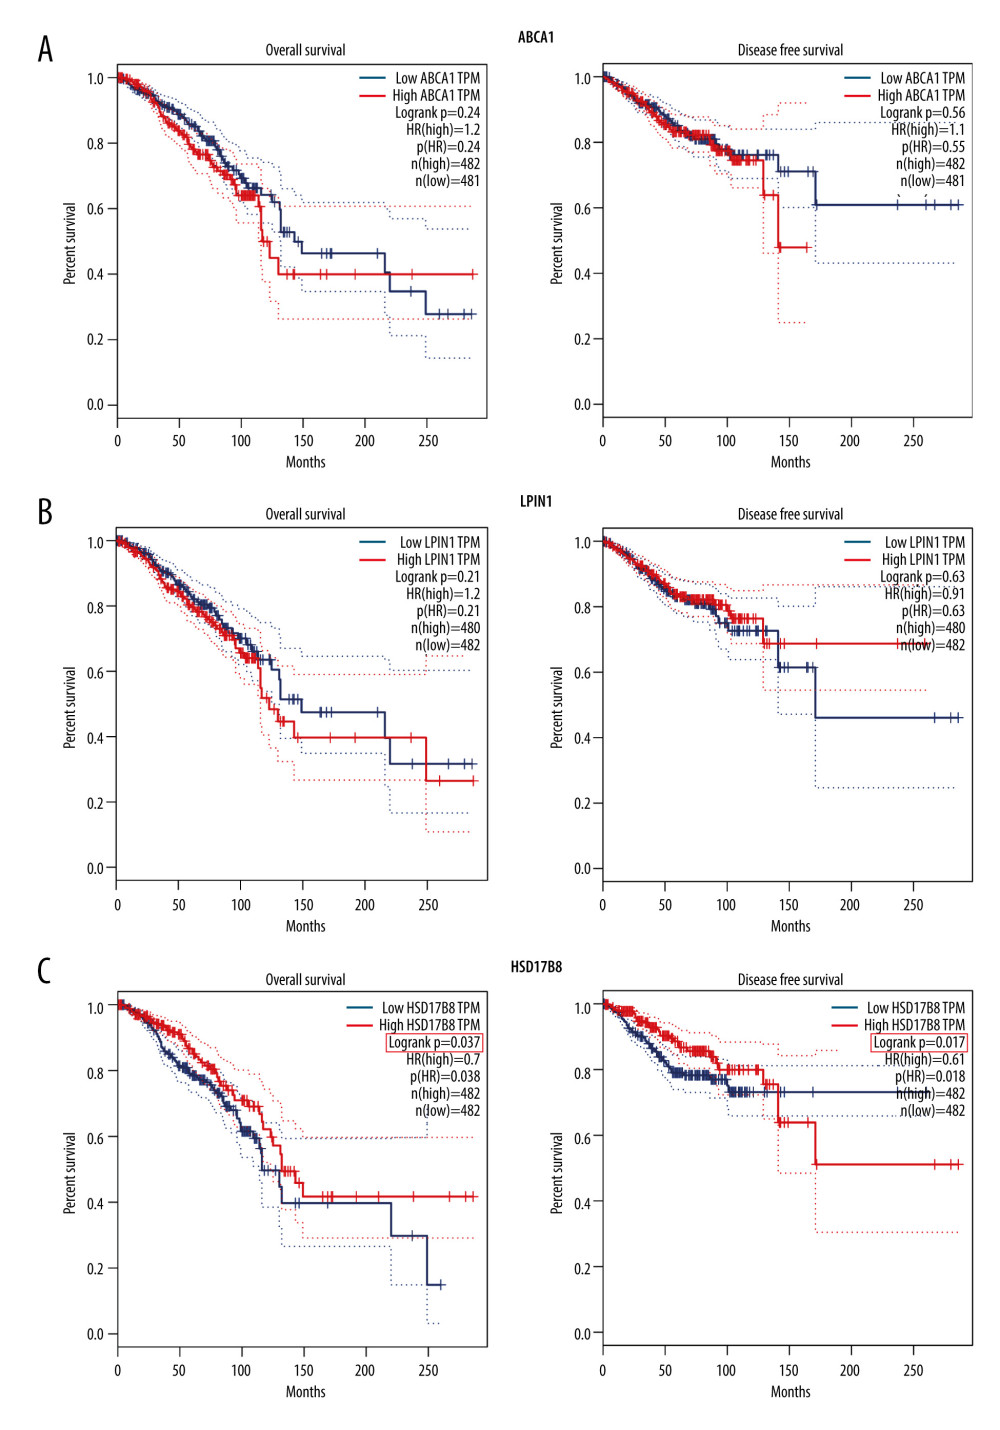 Figure 8. The verification results of GEPIA database. (A) The Kaplan-Meier survival curve of OS, DFS, and ABCA1 expression. (B) The Kaplan-Meier survival curve of OS, DFS, and LPIN1 expression. (C) The Kaplan-Meier survival curve of OS, DFS, and HSD17B8 expression.
 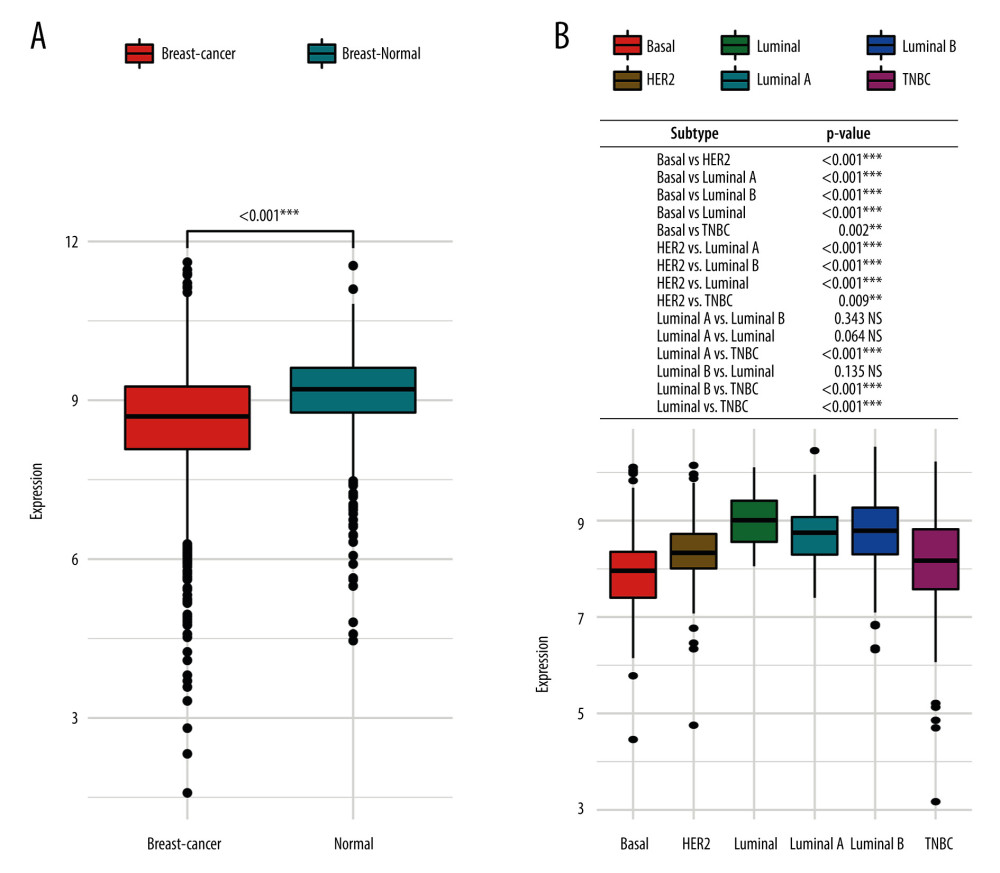 Figure 9. The HSD17B8 expression of breast cancer patients. (A) The HSD17B8 expression of normal breast tissues and breast cancer tissues. (B) The HSD17B8 expression of different subtypes of breast cancer.
 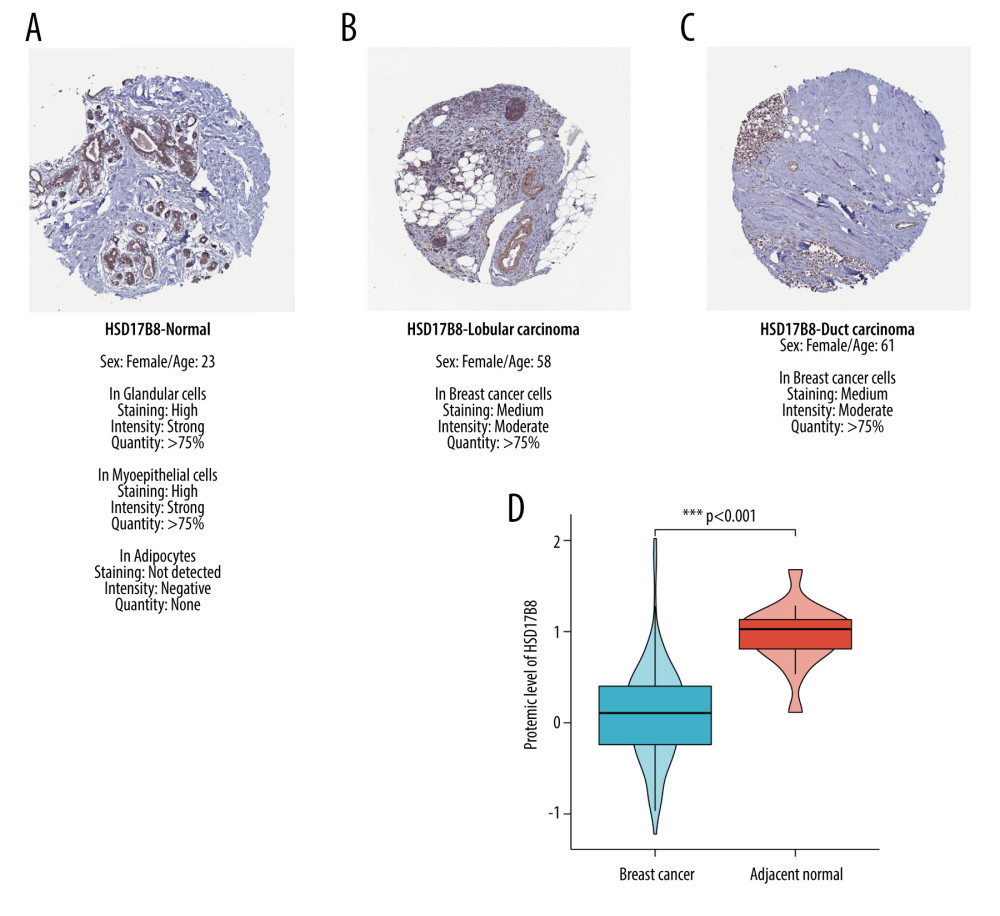 Figure 10. The results of immunochemical staining and expression of HSD17B8 protein. (A) The HSD17B8 immunochemical staining results of normal tissues. (B) The HSD17B8 immunochemical staining results of lobular carcinoma. (C) The HSD17B8 immunochemical staining results of duct carcinoma. (D) The HSD17B8 protein expression between breast cancer and adjacent normal tissue.
 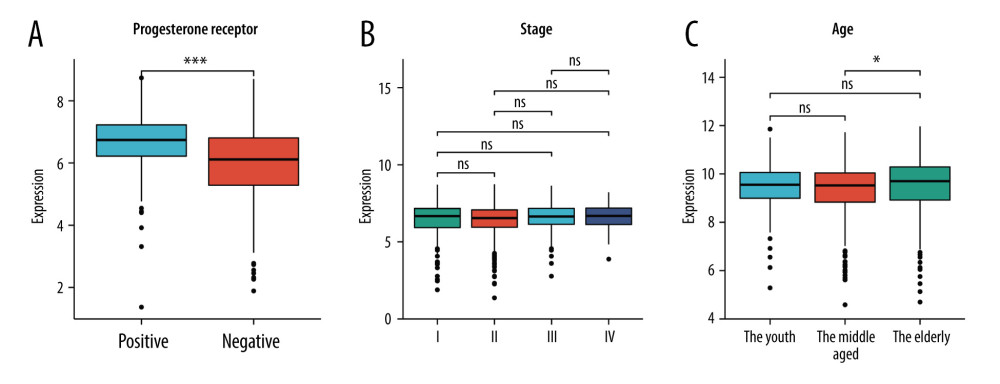 Figure 11. The correlation between HSD17B8 expression and clinical characteristics. (A) The correlation between HSD17B8 expression and PR. (B) The correlation between HSD17B8 expression and stage. (C) The correlation between HSD17B8 expression and age.
 References
1. Garcia-Estevez L, Moreno-Bueno G, Updating the role of obesity and cholesterol in breast cancer: Breast Cancer Res, 2019; 1(21); 35
2. Sung H, Ferlay J, Siegel RL, Global Cancer Statistics 2020: GLOBOCAN estimates of incidence and mortality worldwide for 36 cancers in 185 countries: Cancer J Clin, 2021; 3(71); 209-49
3. Picon-Ruiz M, Morata-Tarifa C, Valle-Goffin JJ, Obesity and adverse breast cancer risk and outcome: Mechanistic insights and strategies for intervention: Cancer J Clin, 2017; 5(67); 378-97
4. Jones LW, Fels DR, West M, Modulation of circulating angiogenic factors and tumor biology by aerobic training in breast cancer patients receiving neoadjuvant chemotherapy: Cancer Prev Res (Phila), 2013; 9(6); 925-37
5. Jiralerspong S, Goodwin PJ, Obesity and breast cancer prognosis: evidence, challenges, and opportunities: J Clin Oncol, 2016; 35(34); 4203-16
6. Barone I, Giordano C, Bonofiglio D, The weight of obesity in breast cancer progression and metastasis: Clinical and molecular perspectives: Semin Cancer Biol, 2020(60); 274-84
7. Morimoto LM, White E, Chen Z, Obesity, body size, and risk of postmenopausal breast cancer: The Women’s Health Initiative (United States): Cancer Causes Control, 2002; 8(13); 741-51
8. Tilg H, Moschen AR, Adipocytokines: Mediators linking adipose tissue, inflammation and immunity: Nat Rev Immunol, 2006; 10(6); 772-83
9. Khoramipour K, Chamari K, Hekmatikar AA, Adiponectin: Structure, physiological functions, role in diseases, and effects of nutrition: Nutrients, 2021; 4(13); 1180
10. Dieudonne MN, Machinal-Quelin F, Serazin-Leroy V, Leptin mediates a proliferative response in human MCF7 breast cancer cells: Biochem Biophys Res Commun, 2002; 1(293); 622-28
11. Toniolo PG, Endogenous estrogens and breast cancer risk: The case for prospective cohort studies: Environ Health Perspect, 1997(105 Suppl 3); 587-9
12. Kaaks R, Rinaldi S, Key TJ, Postmenopausal serum androgens, oestrogens and breast cancer risk: The European prospective investigation into cancer and nutrition: Endocr Relat Cancer, 2005; 4(12); 1071-82
13. Wang L, Zhang S, Wang X, The metabolic mechanisms of breast cancer metastasis: Front Oncol, 2020; 10; 602416
14. Zhang F, Liu S, Mechanistic insights of adipocyte metabolism in regulating breast cancer progression: Pharmacol Res, 2020; 155; 104741
15. Walker JM, Garcet S, Aleman JO, Obesity and ethnicity alter gene expression in skin: Sci Rep, 2020; 1(10); 14079
16. Nagy Á, Munkácsy G, Győrffy B, Pancancer survival analysis of cancer hallmark genes: Sci Rep, 2021; 1(11); 6047
17. Tang Z, Li C, Kang B, GEPIA: A web server for cancer and normal gene expression profiling and interactive analyses: Nucleic Acids Res, 2017; W1(45); W98-102
18. Park SJ, Yoon BH, Kim SK, GENT2: An updated gene expression database for normal and tumor tissues: BMC Med Genomics, 2019; 12(Suppl 5); 101
19. Mertins P, Mani DR, Ruggles KV, Proteogenomics connects somatic mutations to signalling in breast cancer: Nature, 2016; 7605(534); 55-62
20. Navani S, Manual evaluation of tissue microarrays in a high-throughput research project: The contribution of Indian surgical pathology to the Human Protein Atlas (HPA) project: Proteomics, 2016; 8(16); 1266-70
21. Ritchie ME, Phipson B, Wu D, limma powers differential expression analyses for RNA-sequencing and microarray studies: Nucleic Acids Res, 2015; 7(43); e47
22. Yu G, Wang LG, Han Y, clusterProfiler: An R package for comparing biological themes among gene clusters: Omics, 2012; 5(16); 284-87
23. Robin X, Turck N, Hainard A, pROC: An open-source package for R and S+ to analyze and compare ROC curves: BMC Bioinformatics, 2011; 12; 77
24. Quazi F, Molday RS, Differential phospholipid substrates and directional transport by ATP-binding cassette proteins ABCA1, ABCA7, and ABCA4 and disease-causing mutants: J Biol Chem, 2013; 288(48); 34414-26
25. Marcil M, Brooks-Wilson A, Clee SM, Mutations in the ABC1 gene in familial HDL deficiency with defective cholesterol efflux: Lancet, 1999; 354(9187); 1341-46
26. Han GS, Carman GM, Characterization of the human LPIN1-encoded phosphatidate phosphatase isoforms: J Biol Chem, 2010; 285(19); 14628-38
27. Hunkeler M, Hagmann A, Stuttfeld E, Structural basis for regulation of human acetyl-CoA carboxylase: Nature, 2018; 558(7710); 470-74
28. Ohno S, Nishikawa K, Honda Y: Mol Cell Biochem, 2008; 309(1–2); 209-15
29. Masuda N, Lee SJ, Ohtani S, Adjuvant capecitabine for breast cancer after preoperative chemotherapy: N Engl J Med, 2017; 22(376); 2147-59
30. Natori A, Ethier JL, Amir E, Capecitabine in early breast cancer: A meta-analysis of randomised controlled trials: Eur J Cancer, 2017; 77; 40-47
31. Kim JM, Chen DS, Immune escape to PD-L1/PD-1 blockade: Seven steps to success (or failure): Ann Oncol, 2016; 8(27); 1492-504
32. Clark AS, Karasic TB, DeMichele A, Palbociclib (PD0332991)-a selective and potent cyclin-dependent kinase inhibitor: A review of pharmacodynamics and clinical development: JAMA Oncol, 2016; 2(2); 253-60
33. Turner NC, Slamon DJ, Ro J, Overall survival with palbociclib and fulvestrant in advanced breast cancer: N Engl J Med, 2018; 20(379); 1926-36
34. Finn RS, Martin M, Rugo HS, Palbociclib and letrozole in advanced breast cancer: N Engl J Med, 2016; 20(375); 1925-36
35. Nowinski SM, Solmonson A, Rusin SF, Mitochondrial fatty acid synthesis coordinates oxidative metabolism in mammalian mitochondria: Elife, 2020; 9; e58041
36. Venkatesan R, Sah-Teli SK, Awoniyi LO, Insights into mitochondrial fatty acid synthesis from the structure of heterotetrameric 3-ketoacyl-ACP reductase/3R-hydroxyacyl-CoA dehydrogenase: Nat Commun, 2014; 5; 4805
37. Zeng M, Xu J, Zhang Z, Htd2 deficiency-associated suppression of α-lipoic acid production provokes mitochondrial dysfunction and insulin resistance in adipocytes: Redox Biol, 2021; 41; 101948
38. Collaborative Group on Hormonal Factors in Breast Cancer, Type and timing of menopausal hormone therapy and breast cancer risk: Individual participant meta-analysis of the worldwide epidemiological evidence: Lancet, 2019; 394(10204); 1159-68
39. Kulkoyluoglu-Cotul E, Arca A, Madak-Erdogan Z, Crosstalk between estrogen signaling and breast cancer metabolism: Trends Endocrinol Metab, 2019; 1(30); 25-38
40. Clemons M, Goss P, Estrogen and the risk of breast cancer: N Engl J Med, 2001; 4(344); 276-85
41. Hammes SR, Levin ER, Impact of estrogens in males and androgens in females: J Clin Invest, 2019; 5(129); 1818-26
42. Hickey TE, Selth LA, Chia KM, The androgen receptor is a tumor suppressor in estrogen receptor-positive breast cancer: Nat Med, 2021; 2(27); 310-20
43. Mishra A, Srivastava A, Pateriya A, Metabolic reprograming confers tamoxifen resistance in breast cancer: Chem Biol Interact, 2021; 347; 109602
44. Poirier D, Roy J, Maltais R, A Targeted-covalent inhibitor of 17β-HSD1 blocks two estrogen-biosynthesis pathways: In vitro (metabolism) and in vivo (xenograft) studies in T-47D breast cancer models: Cancers (Basel), 2021; 8(13); 1841
45. Collin LJ, Ulrichsen SP, Ahern TP, 17β-Hydroxysteroid dehydrogenase 1: 2 and breast cancer recurrence: A Danish population-based study: Acta Oncol, 2020; 3(59); 329-33
46. Cortés-Benítez F, Roy J, Perreault M, 16-Picolyl-androsterone derivative exhibits potent 17β-HSD3 inhibitory activity, improved metabolic stability and cytotoxic effect on various cancer cells: Synthesis, homology modeling and docking studies: J Steroid Biochem Mol Biol, 2021; 210; 105846
47. Wang X, Gérard C, Thériault JF, Synergistic control of sex hormones by 17β-HSD type 7: A novel target for estrogen-dependent breast cancer: J Mol Cell Biol, 2015; 6(7); 568-79
48. Thériault JF, Poirier D, Lin SX, The multi-specific human 17 beta-hydroxysteroid dehydrogenase type 7: Non-competitive inhibitors can target different catalyses to facilitate breast cancer treatment: J Steroid Biochem Mol Biol, 2021; 214; 105963
Figures
Figure 1. The analysis flow chart of the study.Figure 2. Volcano plots of GSE151839. (A) DEGs of Fat group. (B) DEGs of Skin group.Figure 3. Venn plots of union DEGs/intersection OMGs. (A) The union of upregulated DEGs. (B) The union of downregulated DEGs. (C) The upregulated OMGs. (D) The downregulated OMGs.Figure 4. The enrichment analysis results. (A) Go enrichment results of OMGs. (B) KEGG enrichment results of OMGs.Figure 5. Kaplan-Meier survival curves of clinic traits. (A) The Kaplan-Meier survival curve of OS and age. (B) The Kaplan-Meier survival curve of OS and stage. (C) The Kaplan-Meier survival curve of OS and progesterone receptor.Figure 6. Results of hub OMGs screening. (A) The results of univariate Cox regression analysis. (B) The results of intersection genes. (C) The Kaplan-Meier survival curve of OS and hub OMGs expression.Figure 7. The verification results of Kaplan-Meier plotter database. (A) The Kaplan-Meier survival curve of OS and ABCA1 expression. (B) The Kaplan-Meier survival curve of OS and LPIN1 expression. (C) The Kaplan-Meier survival curve of OS and HSD17B8 expression.Figure 8. The verification results of GEPIA database. (A) The Kaplan-Meier survival curve of OS, DFS, and ABCA1 expression. (B) The Kaplan-Meier survival curve of OS, DFS, and LPIN1 expression. (C) The Kaplan-Meier survival curve of OS, DFS, and HSD17B8 expression.Figure 9. The HSD17B8 expression of breast cancer patients. (A) The HSD17B8 expression of normal breast tissues and breast cancer tissues. (B) The HSD17B8 expression of different subtypes of breast cancer.Figure 10. The results of immunochemical staining and expression of HSD17B8 protein. (A) The HSD17B8 immunochemical staining results of normal tissues. (B) The HSD17B8 immunochemical staining results of lobular carcinoma. (C) The HSD17B8 immunochemical staining results of duct carcinoma. (D) The HSD17B8 protein expression between breast cancer and adjacent normal tissue.Figure 11. The correlation between HSD17B8 expression and clinical characteristics. (A) The correlation between HSD17B8 expression and PR. (B) The correlation between HSD17B8 expression and stage. (C) The correlation between HSD17B8 expression and age. Tables
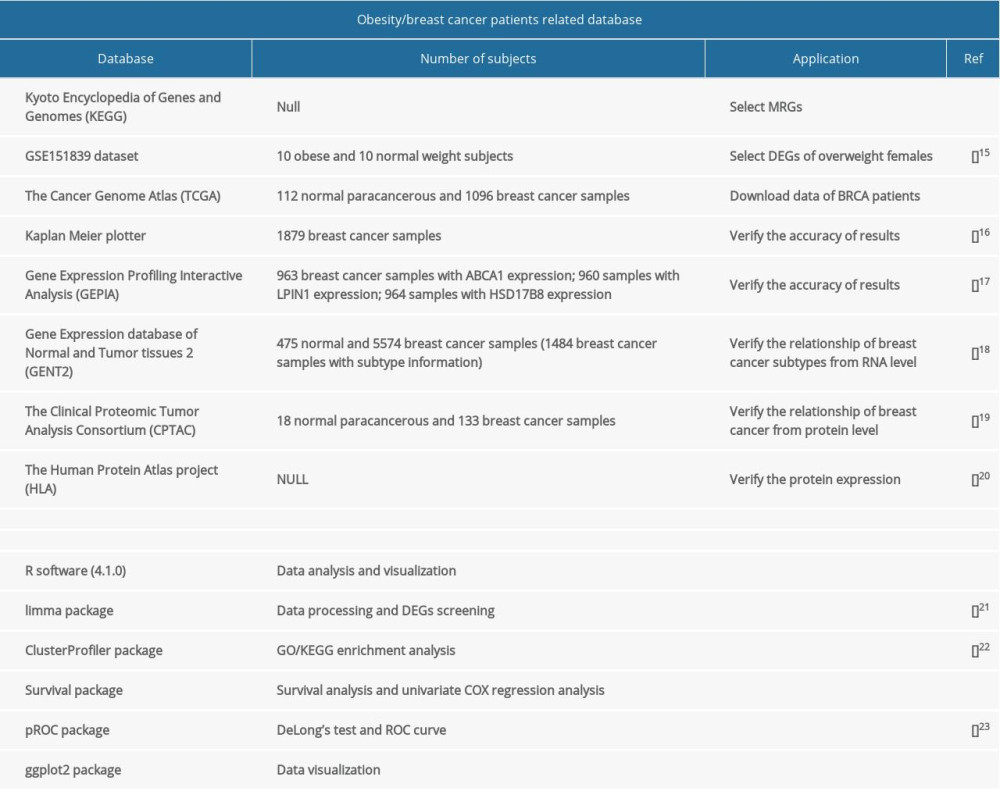 Table 1. Databases and software used in the study.
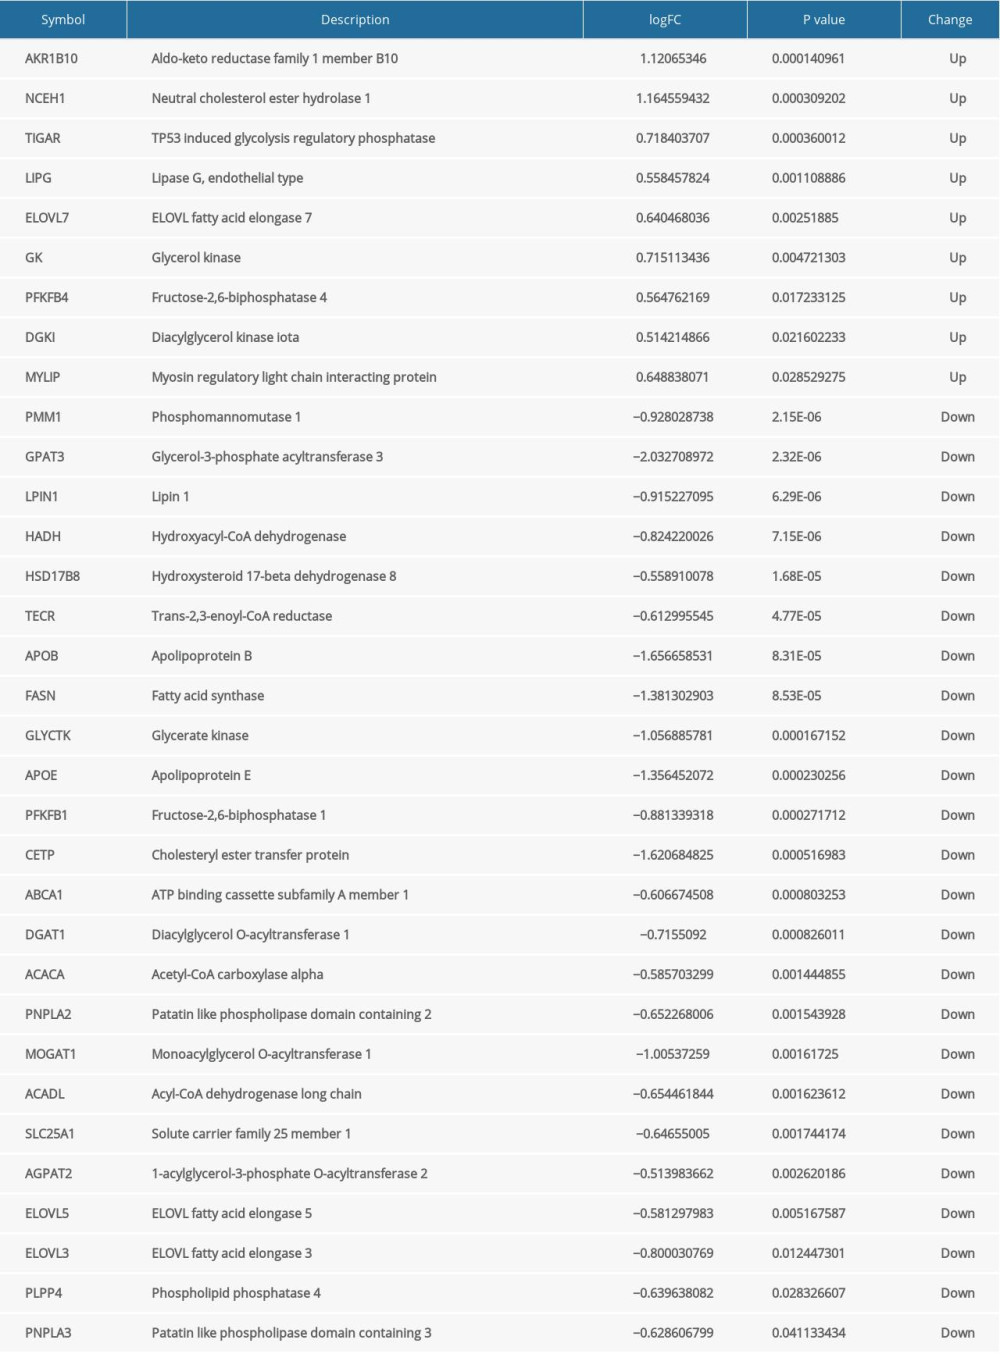 Table 2. Differential expression of metabolic genes in overweight females.
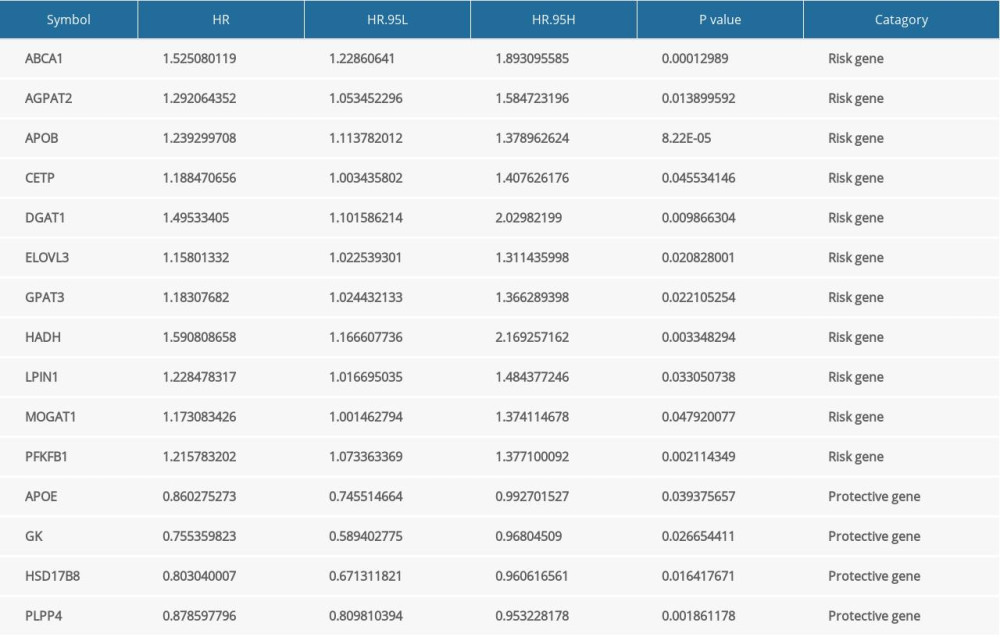 Table 3. Information on prognostic MRGs.
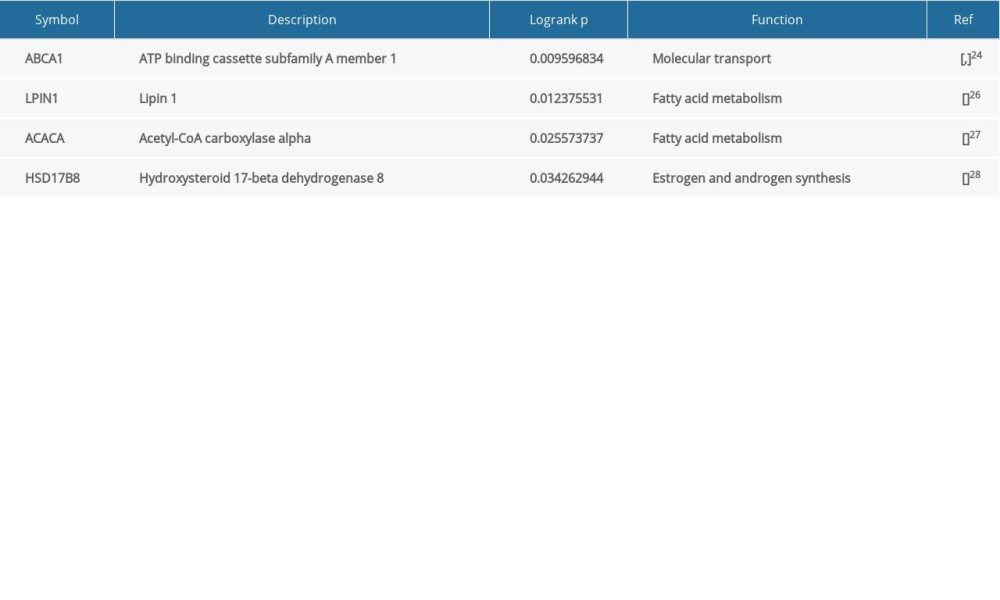 Table 4. Results of long-rank P test of MRGs.
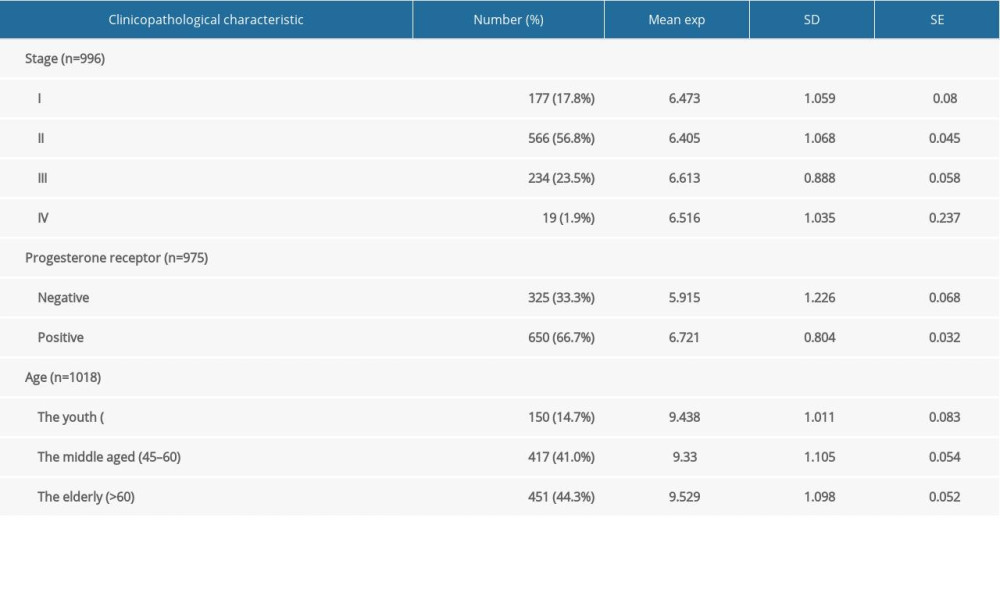 Table 5. Clinical information of breast cancer patients.Table 1. Databases and software used in the study.Table 2. Differential expression of metabolic genes in overweight females.Table 3. Information on prognostic MRGs.Table 4. Results of long-rank P test of MRGs.Table 5. Clinical information of breast cancer patients.
 In Press
06 Mar 2024 : Clinical Research
Comparison of Outcomes between Single-Level and Double-Level Corpectomy in Thoracolumbar Reconstruction: A ...Med Sci Monit In Press; DOI: 10.12659/MSM.943797
21 Mar 2024 : Meta-Analysis
Economic Evaluation of COVID-19 Screening Tests and Surveillance Strategies in Low-Income, Middle-Income, a...Med Sci Monit In Press; DOI: 10.12659/MSM.943863
10 Apr 2024 : Clinical Research
Predicting Acute Cardiovascular Complications in COVID-19: Insights from a Specialized Cardiac Referral Dep...Med Sci Monit In Press; DOI: 10.12659/MSM.942612
06 Mar 2024 : Clinical Research
Enhanced Surgical Outcomes of Popliteal Cyst Excision: A Retrospective Study Comparing Arthroscopic Debride...Med Sci Monit In Press; DOI: 10.12659/MSM.941102
Most Viewed Current Articles
17 Jan 2024 : Review article
Vaccination Guidelines for Pregnant Women: Addressing COVID-19 and the Omicron VariantDOI :10.12659/MSM.942799
Med Sci Monit 2024; 30:e942799
14 Dec 2022 : Clinical Research
Prevalence and Variability of Allergen-Specific Immunoglobulin E in Patients with Elevated Tryptase LevelsDOI :10.12659/MSM.937990
Med Sci Monit 2022; 28:e937990
16 May 2023 : Clinical Research
Electrophysiological Testing for an Auditory Processing Disorder and Reading Performance in 54 School Stude...DOI :10.12659/MSM.940387
Med Sci Monit 2023; 29:e940387
01 Jan 2022 : Editorial
Editorial: Current Status of Oral Antiviral Drug Treatments for SARS-CoV-2 Infection in Non-Hospitalized Pa...DOI :10.12659/MSM.935952
Med Sci Monit 2022; 28:e935952