23 March 2022: Animal Study
Analysis of Genes Associated with Both Neural Tube Defects and Neuroectodermal Tumors
Rui Cao12ABCDEFG*, Jiaqi Li1C, Li Zhang13CE, Jianting Li1AE, Yuxiang Liang1C, Ruifang Ao1F, Ying Wang1D, Hang Li1D, Xin Lu1D, Zhizhen Liu1A, Hong Zhao1AB, Jun Xie1AEGDOI: 10.12659/MSM.936079
Med Sci Monit 2022; 28:e936079


Abstract
BACKGROUND: Previous studies have demonstrated that embryo development and the occurrence of tumors are closely related, as key genes, pathways, miRNAs, and other biological mechanisms are involved in both processes. Extensive research has found that abnormal development of nerve ectodermal cells not only leads to neural tube defects (NTDs), but also neuroectodermal tumors.
MATERIAL AND METHODS: Genes associated with both NTDs and neuroectodermal tumors were obtained from the DisGeNET database. The STRING database was used to construct the protein–protein interaction (PPI) network and the hub genes were visualized using Cytoscape. Additionally, we predicted the miRNAs targeting the identified genes. Sequencing data obtained from an NTDs mouse model and human samples were used to confirm the bioinformatics results. Moreover, a dual-luciferase report assay was used to validate the targeting relationship between the miRNA-gene pairs identified.
RESULTS: A total of 104 intersection genes of NTDs-related and neuroectodermal tumors-related genes were obtained; 20 of these genes were differentially expressed in NTDs samples and had very close interactions. Among 10 hub genes, we identified 3 important susceptibility genes differentially expressed both in RA-induced NTDs mice and human glioblastoma samples: Ncam1, Shh, and Ascl1. Among these, we found that the Ncam1 expression level was regulated by mmu-miR-30a-5p, and the Ascl1 expression level was regulated by mmu-miR-375-3p.
CONCLUSIONS: In conclusion, we identified differentially expressed genes and a potential miRNA-mediated regulation mechanism shared between NTDs and neuroectodermal tumors that may guide future studies aiming to find novel therapeutic targets for NTDs or neuroectodermal tumors.
Keywords: NCAM1 Protein, Human, MicroRNAs, ASCL1 Protein, Human, Neural Tube Defects, Neuroectodermal Tumors, Animals, Computational Biology, Gene Expression Profiling, Gene Regulatory Networks, Mice, Protein Interaction Maps
Background
During embryonic development, a fertilized egg develops into an embryo by undergoing cell division and subsequent cell differentiation processes. Similarly, tumors develop by the abnormal proliferation and differentiation of cells due to the presence of mutations in key genes that regulate the cell cycle. The concept of the embryogenic origin of tumors, which was first suggested by the French biologists Lobstein and Recamier in 1892, states that tumor cells are very similar to embryonic cells and that tumor cells are derived from the continuous proliferation of embryonic cells [1]. In 1983, Pierce et al proposed that a tumor was a developmental biology problem and further highlighted the close relationship between the occurrence of tumors and embryo development [2].
Neural tube defects (NTDs) are a common congenital birth defect caused by the inadequate closure of the neural tube during embryo development. In most vertebrates, hollow neural tubes are formed as neuroectoderm cells proliferate, invaginate, and eventually migrate from the surface of the ectoderm [3–6]. Among all types of human tumor tissues, 6 classes derive from the neuroectoderm during early embryo development: primitive neuroectodermal tumor, glioma, glioblastoma (GBM), neuroblastoma, neurilemmoma, and medulloblastoma [7,8]. GBM is a brain tumor with high incidence and mortality rates, for which only a limited number of treatments are currently available.
The neural tube is the main primordium of the central nervous system. It gives rise to the glial cells, which retain the ability to proliferate throughout life. Most adult neurological tumors are of glial origin. These tumors are termed gliomas [9], and GBM is the most malignant form of glioma [10]. Therefore, from a developmental perspective, the embryonic origin of GBM tissue is the neural tube. It is perhaps not surprising that there are case reports of patients with both GBM and NTDs [11] and that individuals with congenital nervous system defects are at higher risk of developing neurological tumors [12]. One out of 10 babies with NTDs die before their first year [13]. GBM is also a disease with a high mortality rate, and the 5-year survival rate is less than 10% [14,15]. Although it is difficult to obtain samples of both diseases in the same patient, it does not prevent scientists from studying the shared genes and potential mechanisms of the 2 diseases. Previous studies have reported several genes associated with both NTDs and GBM. To the best of our knowledge, the p53 pathway contributes to NTDs and to GBM pathogenesis [16]; aberrant expression of the platelet-derived growth factor receptor-α (PDGFRA) gene has been associated with NTDs and GBM [17]; and insulin-like growth factor binding protein 2 (IGFBP2) mRNA levels remain high during the neural tube closure and are frequently overexpressed in GBMs [18]. Nonetheless, the underlying molecular mechanisms are still poorly understood, highlighting the need to better understand the mechanisms regulating the expression of key genes involved in cell proliferation during embryo development and tumorigenesis. Many studies have shown that microRNAs (miRNAs) such as miR-30, miR-9, and miR-375 play an important role in neural tube closure during the early embryonic development and in tumorigenesis [19–25].
Therefore, finding core genes and potential pathways associated with both NTDs and neuroectodermal tumors will contribute to understanding their pathogenesis as well as developing targeted treatments. Our study revealed the key genes associated with NTDs and neuroectodermal tumors, and their potential mechanism.
Material and Methods
ANIMALS:
ICR mice (9–11 weeks, 19–25 g) were provided by the Animal Center of Shanxi Medical University and raised in specific pathogen-free cages at the animal center with a 12-h light/dark cycle, keeping the temperature and humidity within the range of 20–26ºC and 40–70%, respectively. The NTDs mouse model was established by gavage of 28 mg/kg retinoic acid (RA) to pregnant mice at embryonic day 7.5 (E7.5). The control pregnant mice were treated with the same dose of sesame oil. The brain vesicles of mouse embryos were collected at E9.5 and E10.5. Total RNA was extracted using the TRIzol method (Ambion, USA), and cDNA was synthesized using a Revert Aid First Strand cDNA Synthesis Kit (Takara, Japan).
COLLECTION OF GBM SAMPLES:
All GBM samples were collected from the Neurosurgery Department of Shanxi Cancer Hospital. Normal adjacent tissue was obtained from the extended excision domain of GBM neurosurgical resections. Ethics approval was obtained from the Ethics Review Board of Shanxi Cancer Hospital.
GENE SET ANALYSIS:
The DisGeNET database was used to identify genes associated with NTDs and 6 kinds of neuroectodermal tumors. DisGeNET is a platform integrating standardized data on disease-associated genes from multiple sources. The current release covers more than 24 000 diseases and traits, 17 000 genes, and 117 000 genomic variants [26,27]. It provides a ‘score_gda’ that reflects how well established a particular association is based on current knowledge by giving the highest value to associations reported by several databases, particularly those reported by expert-curated resources, and with a large number of supporting publications. We selected different kinds of disease-associated genes with a score_gda higher than the mean score of all genes.
GENE EXPRESSION LEVEL ANALYSIS:
To confirm the gene expression levels of the identified disease-associated genes, we used the mRNA-sequencing data from mouse and human NTDs samples. Since the NTDs-susceptibility genes screened using animal models do not necessarily reflect the human pathological mechanisms, we considered only those genes that had similar expression trends both in mouse models and human NTDs samples as candidate genes.
mRNA sequencing data from the RA-induced NTDs mouse model were obtained by our research team, as reported in our previous study [28]. Transcriptome data were collected at E8.5, E9.5, and E10.5. Briefly, the samples were sequenced using the Illumina HiSeqTM 2000 sequencing platform. mRNA sequencing data of human NTDs samples were obtained by our research team in a previous study [29]. Briefly, in that previous study, embryos with a gestational age of approximately 17 weeks were diagnosed with spina bifida and age-matched normal embryos were obtained from abortions. Affymetrix HG-U133A 2.0 GeneChip arrays were used to examine the gene expression profile of these samples.
HUB GENES ANALYSIS:
The STRING database was used to construct a protein–protein interaction (PPI) network. This database mainly comprises information about interacting proteins collected from experimental data. The current version contains 3 123 056 667 interaction pairs, which originate from 24 584 628 proteins and 5090 organisms [30]. Cytoscape was used to visualize the network [31]. Hub genes were selected using the Maximal Clique Centrality algorithm [32].
PREDICTION AND CONFIRMATION OF THE POTENTIAL MIRNA-MRNA PAIRS:
StarBase was used to predict the miRNAs targeting the hub genes identified. StarBase is a database facilitating the comprehensive exploration of miRNA-target interaction maps from CLIP-Seq and Degradome-Seq data. The current version includes high-throughput sequencing data generated from 21 CLIP-Seq and 10 Degradome-Seq studies [33]. To confirm the potential miRNA-mRNA pairs, we used the miRNA-sequencing data from the mouse model of NTDs that was previously published by our research team [34]. Here, the NTDs mouse model was constructed identically according to our previous study. Using these data, we selected the miRNAs with opposite expression trends to the hub genes as candidate miRNAs.
QUANTITATIVE REVERSE TRANSCRIPTION PCR (RT-QPCR) ANALYSIS:
The mRNA expression level of hub genes in the RA-induced NTDs mice and human GBM samples was assessed using RT-qPCR. qPCR was performed using Maxima SYBR Green/ROX qPCR Master Mix (Takara, Japan). The data were analyzed with 2−ΔΔCt method. The mRNA expression level of the target genes was normalized to that of Gapdh. Primer sequences are shown in the Supplementary Tables 1 and 2.
DUAL-LUCIFERASE ANALYSIS:
A dual-luciferase report assay was used for the validation of the miRNA-gene pairs. The luciferase reporter plasmid was built using the pmirGLO vector, into which the wild-type and mutant candidate genes were cloned. For this purpose, an appropriate number of 293T cells were seeded into a 12-well plate and cultured at 37°C in an incubator overnight. Cells were co-transfected with the luciferase reporter plasmids and miRNA mimics/mimics control using Lipofectamine 2000 (Invitrogen), and the efficiency of transfection was assessed. After 24 h, Firefly and Renilla luciferase activity were detected with a Dual-Luciferase Reporter Assay kit (PR-E1910, Promega, Wisconsin, USA). Relative luciferase activity was defined as the ratio of Renilla luciferase activity to the Firefly luciferase activity with that of the control set as 1.0. Briefly, cells were washed with phosphate-buffered saline, and 400 μL of 1×Passive Lysis Buffer (Promega) was added to the cultured well and shaken gently for 15 min. The lysate was then transferred to a test tube. A total of 20 μL Passive Lysis Buffer lysis buffer was transferred into a white 96-well plate, then 100 μL of LARII (Promega) was added to detect Firefly luciferase in Multifunctional Enzyme Marker. A total of 100 μL of Stop&Glo (Promega) was used to detect Renilla luciferase activity.
STATISTICAL ANALYSIS:
Statistical analysis was performed using GraphPad Prism software, version 8.0. Data were expressed as the mean±S.D. The
Results
INTERSECTING GENES BETWEEN NTDS AND NEUROECTODERMAL TUMORS:
A total of 304 NTDs-associated genes and 9572 neuroectodermal tumors-associated genes were downloaded from the DisGeNET database. Table 1 shows the number of genes associated with the 6 kinds of neuroectodermal tumors. Subsequently, we identified the genes that were associated with both NTDs and neuroectodermal tumors. A total of 104 overlapping genes were considered as candidate genes for further analyses (Figure 1).
BIOINFORMATICS ANALYSIS OF THE GENES:
Among the 104 overlapping genes, differentially expressed genes (DEGs) were selected using the threshold criteria of P value ≤0.05 and |Log2Ratio| ≥1 based on NTDs mouse transcriptome data. A total of 3 genes were differentially expressed at E8.5, 14 at E9.5, and 24 at E10.5, as shown in Figure 2.
A PPI interaction network was constructed and visualized for the 27 DEGs using the STRING database and Cytoscape software. The PPI revealed that 20 of these interacted very closely. The resulting 10 hub genes identified using the maximal clique centrality algorithm were: Pou5f1, Bmp4, Shh, Cdh1, Ncam1, Snai2, Igf2, Ascl1, Anxa5, and Ccl2 (Figure 3).
Four of the 10 hub genes had the same expression trend in human NTDs data as in mouse NTDs data. These genes were
Hence, we further explored the potential mechanism whereby these genes are involved in the pathological mechanism of both NTDs and neuroectodermal tumors. As miRNAs are a type of small non-coding RNA that plays an important role in regulating gene expression [35], using StarBase V2.0, we predicted miRNAs regulate expression levels of the candidate genes. A total of 180 miRNAs with 245 targeted binding sites were predicted for Ncam1, 130 miRNAs with 170 targeted binding sites were predicted for Cdh1, 14 miRNAs with 14 sites were predicted for Shh, and 24 miRNAs with 34 sites were predicted for Ascl1.
We then used the RA-induced NTDs mouse model’s mRNA-sequencing and miRNA-sequencing data to filter the predicted results. For this purpose, only miRNA-mRNA pairs with opposite expression trends both at E9.5 and E10.5 were retained. A total of 38 miRNA binding sites for Ncam1, 1 miRNA binding site for Ascl1, and 32 miRNA binding sites for Cdh1 were obtained. miRNAs with the highest differential expression fold value were selected. Finally, we considered mmu-miR-30a-5p-Ncam1, mmu-miR-375-3p-Ascl1, and mmu-miR-9-5p-Cdh1 as candidate pairs for experimental verification, as shown in Figure 4.
VALIDATION OF THE EXPRESSION LEVEL OF THE TARGET GENES:
To validate the expression levels of the candidate genes, we assessed the mRNA levels of Ncam1, Cdh1, Shh, and Ascl1 in the brain vesicle tissue of E9.5 and E10.5 mouse embryos using RT-qPCR. Ncam1 and Cdh1 were upregulated in the NTDs mice, whereas Shh and Ascl1 were downregulated in NTDs mice. Additionally, Ncam1, Shh, and Ascl1 were significantly differentially expressed at E9.5 and E10.5; whereas Cdh1 was significantly differentially expressed at E10.5, as shown in Figures 5 and 6. Moreover, we validated expression levels of these 4 candidate genes in GBM samples using RT-qPCR. Shh and Ncam1 were significantly upregulated and Ascl1 was significantly downregulated in tumor samples, whereas Cdh1 was not differentially expressed in the tumor samples, as shown in Figure 7. In summary, among the 4 important susceptibility genes, 3 genes (Ncam1, Shh, and Ascl1) were differentially expressed both in RA-induced NTDs mice and human GBM samples.
VALIDATION OF THE INTERACTION BETWEEN THE MIRNAS AND THE TARGET GENES:
To validate the interaction between the selected miRNA-mRNA pairs, we performed a luciferase assay. For this purpose, we co-transfected 293T cells with the luciferase reporter plasmids and mimic control/miRNAs mimic inhibitor using Lipofectamine 2000. To ensure the transfection effect of the formal experiment, we conducted a preliminary experiment using the empty vector plasmid with a red fluorescent signal and acquired images using an ordinary fluorescence microscope to visually show the transfection effect. As shown in Figure 8, the transfection efficiency was high. The results of the dual-luciferase assay are shown in Figure 9. Transfection with the wild-type mmu-miR-30a-5p had an approximately 50% inhibitory effect on Ncam1, whereas the inhibitory effect was not seen with the mutated miRNA. Transfection with wild-type mmu-miR-375-3p inhibited approximately 30% of the expression level of Ascl1, and the inhibitory effect was not seen with the mutated miRNA. However, wild-type mmu-miR-9-5p had no significant effect on the expression of Cdh1, indicating that it did not have a significant specific target binding site on the Cdh1 transcript and that the results predicted by the software lacked sufficient accuracy. The predicted binding sites of the miRNAs and target genes, and the sequence alignments, are shown in Figure 10.
Discussion
With the continuous development of molecular biology tools and assays, a growing number of studies have revealed the similarities between early embryonic cells and tumor cells and the key genes, proteins, and metabolic pathways involved in both processes [36–38]. A landmark study published in the journal
Another large Nordic population-based case-control study indicated that cancer risk increased in individuals with birth defects and persisted into adulthood, both for non-chromosomal and chromosomal anomalies [43]. In our studies, through a series of bioinformatics analyses, we identified 4 important susceptibility genes associated with both NTDs and neuroectodermal tumors:
In conclusion, previous evidence supports a role for these 3 genes in both development and tumorigenesis. Future studies should evaluate the molecular features of patients with co-occurrence of NTDs and neuroectodermal tumors to further elucidate the mechanisms that lead to these complex outcomes. Upon further validation, our findings may help in the development of cancer surveillance protocols for early tumor detection in children with neural tube defects. However, if the models or samples we used have NTDs initially and eventually develop neuroectodermal tumors with the same genetic backgrounds, the DEGs we found will better prove the connection between NTDs and neuroectodermal tumors. Moreover, the RA-induced NTDs mouse model is not a representative NTDs mouse model; therefore, our results obtained from this model alone cannot fully explain the relationship between NTDs and neuroectodermal tumors. Additional models will be required to validate these findings. Furthermore, the susceptibility genes we detected have not been verified in human NTDs samples, and the pathophysiologic significance and clinical utility of our results remain to be determined.
miRNAs are a class of non-coding single-stranded RNA molecules about 22 nucleotides in length. miRNAs are known to participate in the regulation of gene expression at the post-transcriptional level by binding to the target transcript [51]. Through this mechanism, miRNAs drive embryonic development in a variety of species, such as zebrafish, Xenopus toads, and mice [52–54]. A comprehensive study by Guo et al supports a close relationship of miRNA expression between early human embryonic development and tumorigenesis [55]. Many studies have shown that miRNAs are involved in the occurrence of NTDs. miR-30 family members play an important role in regulating the WNT signaling pathway, TGF-β signaling pathway, and focal adhesion during neural differentiation [56]. miR-375 is upregulated in the NTDs mouse model and might be a potential pathway leading to spina bifida [24]. Similarly, miRNAs are also known to regulate gene expression during tumorigenesis, thereby regulating the process. miR-30 family members are downregulated in medulloblastoma, leading to enhanced cancer cell growth and other malignant behavior, and thus is a potential new therapeutic target [20]. In neuroblastoma, miR-375 regulates nerve cells differentiation, thereby contributing to tumorigenesis [57].
Our study verified 2 targeted binding pairs: mmu-miR-30a-5p-
Conclusions
In summary, susceptibility genes related to both NTDs and 6 types of neuroectodermal tumors were obtained. Using bioinformatic analysis, we identified 4 potential candidate genes. Additionally, we demonstrated that 3 of these genes were differentially expressed both in NTDs mice and human GBM samples, and 2 were significantly regulated by miRNAs. This suggests that the dysregulation of their transcriptional control might lead to diseases such as NTDs or neuroectoderm tumors. Altogether, these results provide a theoretical framework supporting the relationship between early embryo development and tumorigenesis and provide the foundation for future studies aiming to identify novel therapies for NTDs or GBM.
Figures
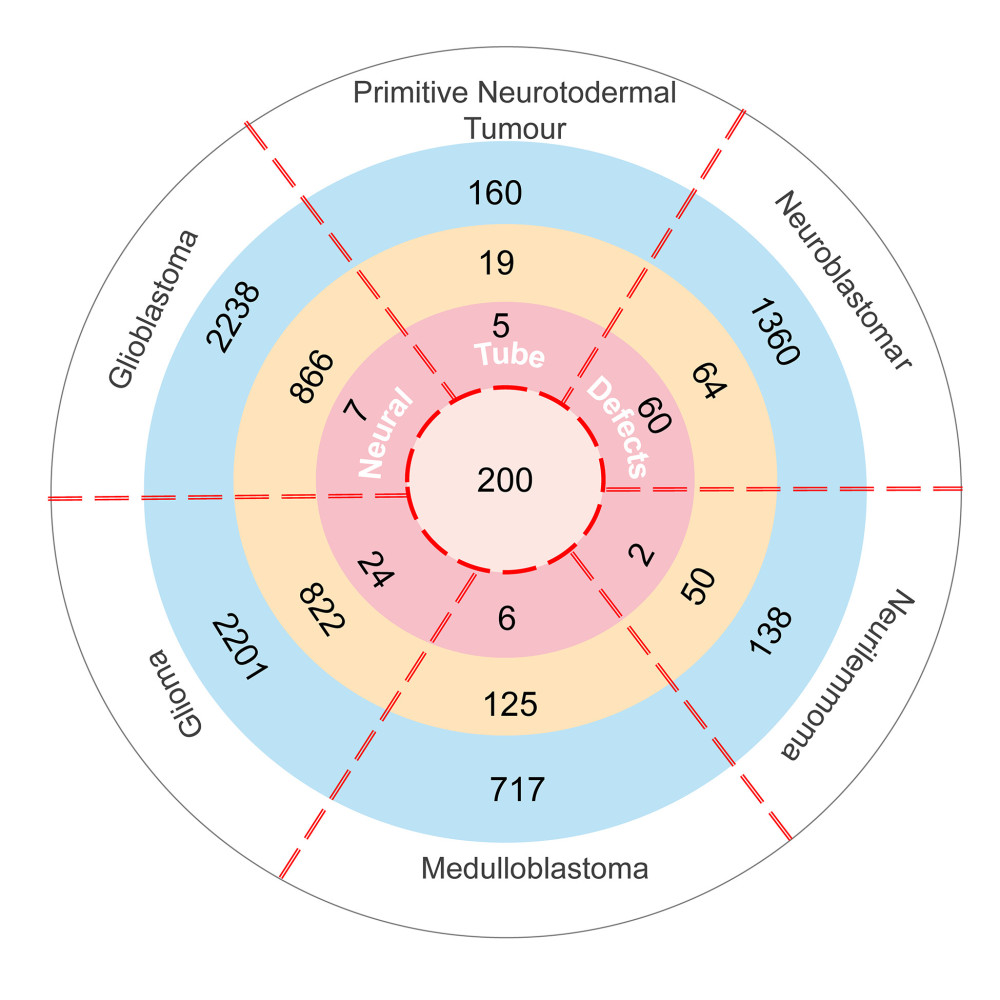 Figure 1. The intersection genes associated with NTDs and neuroectodermal tumors. Deep pink: Genes associated with NTDs and 6 kinds tumors and their Score_gda were higher than the average; Light pink: Genes associated with NTDs only and their Score_gda were less than the average; Orange: Genes associated with 6 kinds of tumors only and their Score_gda were higher than the average; Blue: Genes associated with 6 kinds of tumors only and their Score_gda were less than the average. This figure was created using PowerPoint, version Microsoft Office Home and Student 2019, supported by Microsoft.
 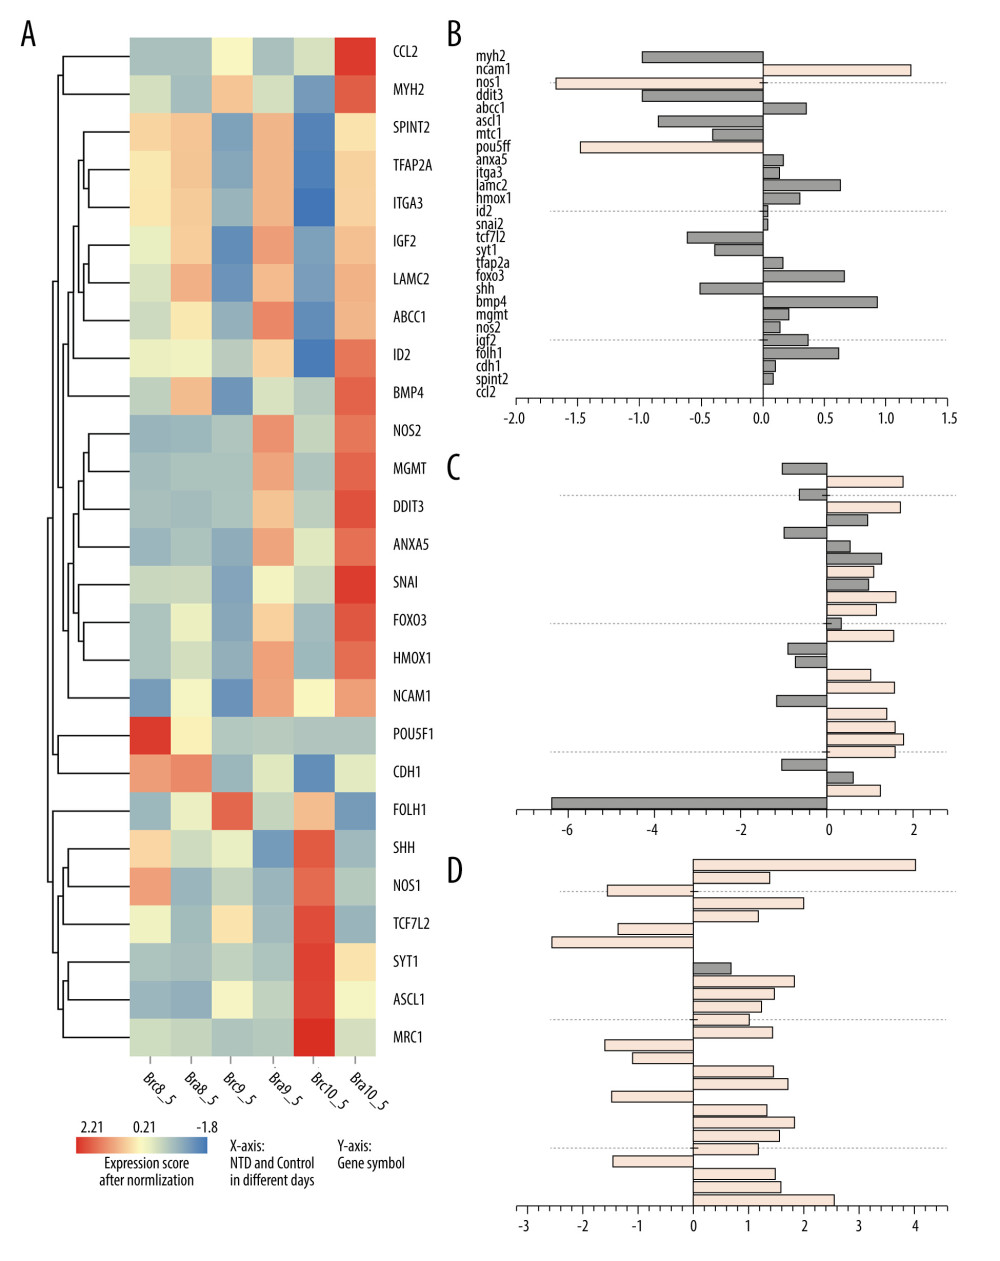 Figure 2. Expression of 27 differentially expressed gene in E8.5, E9.5, and E10.5. (A) Heatmap of DGEs’ expression; (B–D) X-axis: Log2 Ratio in E8.5 (RA/Con), Log2 Ratio in E9.5 (RA/Con), Log2 Ratio in E10.5 (RA/Con) respectively, Y-axis: Gene Symbol. Flesh colored: genes with |log2 Ratio|>1 and P value<0.05; light gray: genes with |log2 Ratio|<1 or P value>0.05. These figures were created by an open-source tool RStudio, version 1.1.456.
 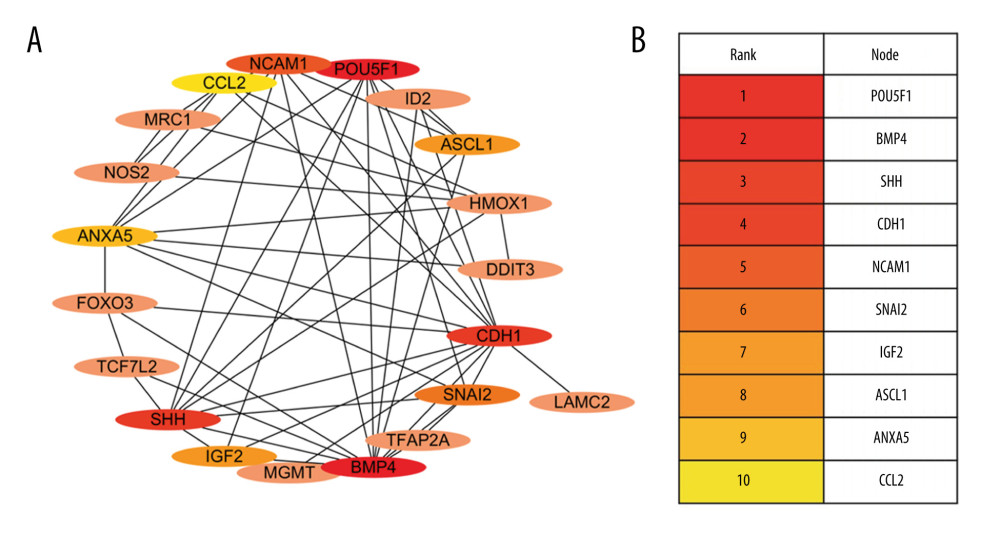 Figure 3. Interactive network of 20 differentially expressed genes. (A) The protein–protein interaction (PPI) network of the DEGs. (B) Hub genes. The PPI network of the DEGs was established through STRING (Search Tool for the Retrieval of Interacting Genes database) website, visualized by Cytoscape, and the hub genes were explored using the CytoHubba plug-in, version 3.42, which is an open-source software platform.
 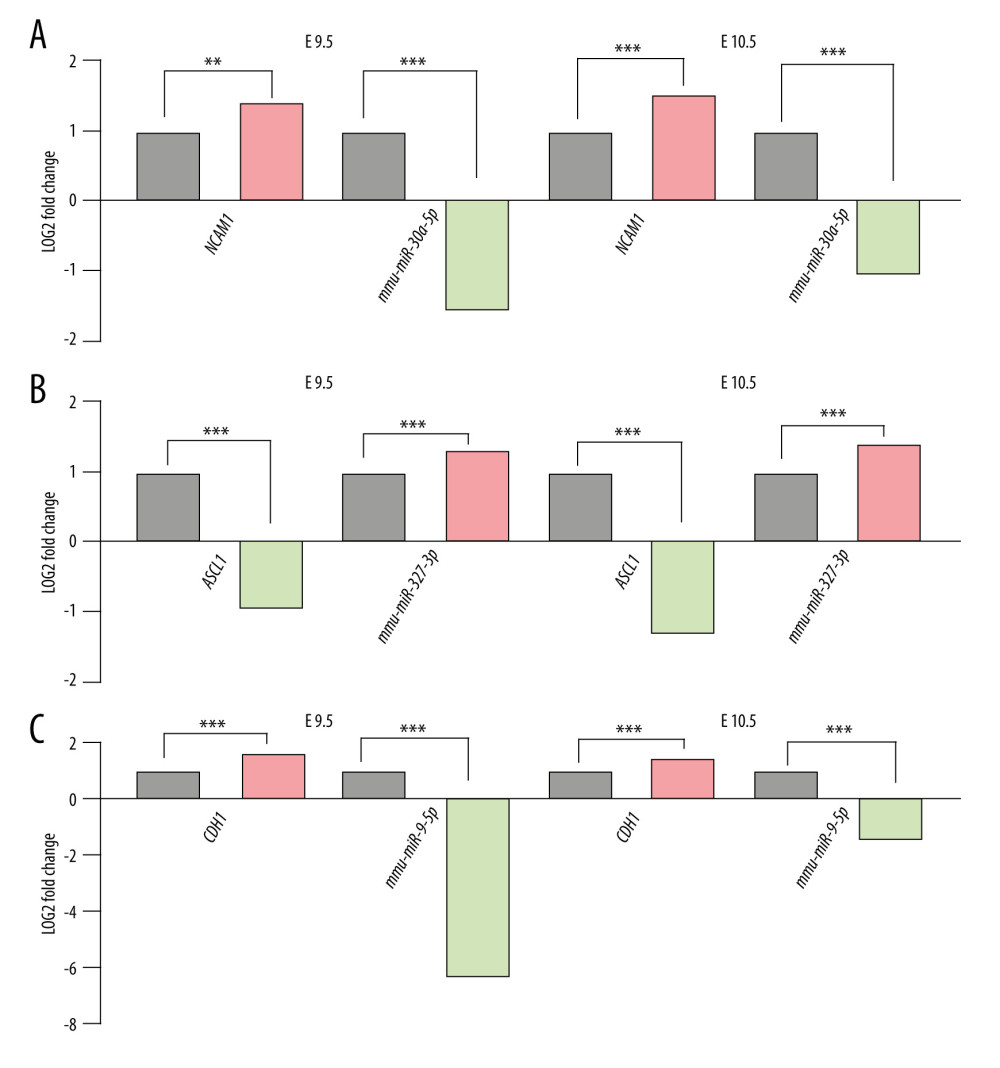 Figure 4. Differential expression of miRNA-mRNA pairs in E9.5 and E10.5. (A) mmu-miR-30a-5p-Ncam1; (B) mmu-miR-375-3p-Ascl1; (C) mmu-miR-9-5p-Cdh1; Gray: Control; Red: Upregulated in NTDs; Green: Downregulated in NTDs. n=3,* P<0.05, ** P<0.01, *** P<0.001. Data were analyzed and visualized using the software GraphPad Prism, version 8.0, supported by GraphPad Software.
 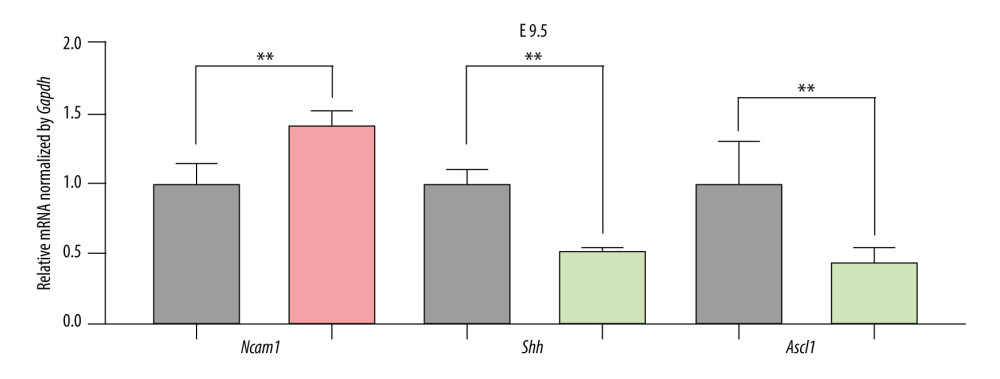 Figure 5. The expression of candidate genes in E9.5. Gray: Control; Red: Upregulated in NTDs; Green: Downregulated in NTDs. n=3,* P<0.05, ** P<0.01, *** P<0.001. Data were analyzed and visualized using the software GraphPad Prism, version 8.0, supported by GraphPad Software.
 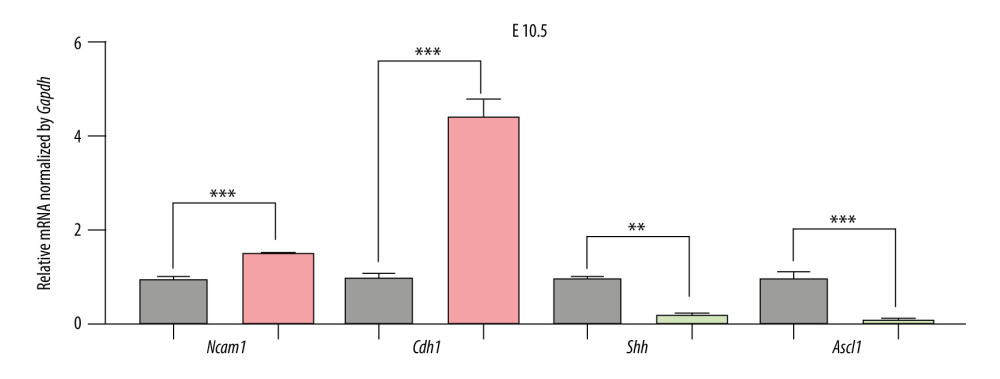 Figure 6. The expression of candidate genes in E10.5. Gray: Control; Red: Up-regulated in NTDs; Green: Downregulated in NTDs. n=3,* P<0.05, ** P<0.01, *** P<0.001. Data were analyzed and visualized using GraphPad Prism, version 8.0, supported by GraphPad Software.
 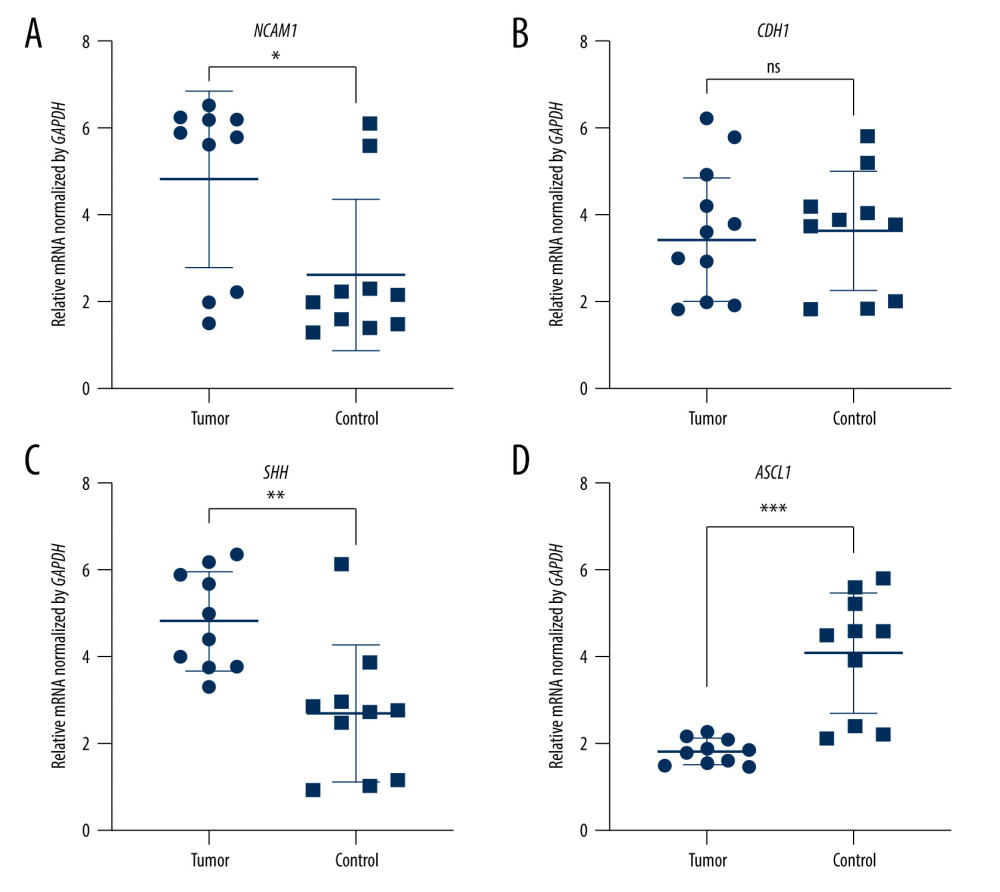 Figure 7. The expression of candidate genes in GBM samples. (A) NCAM1. (B) CDH1. (C) SHH. (D) ASCL1. n=10,* P<0.05, ** P<0.01, *** P<0.001, ns – not significant. Data were analyzed and visualized using GraphPad Prism, version 8.0, supported by GraphPad Software.
 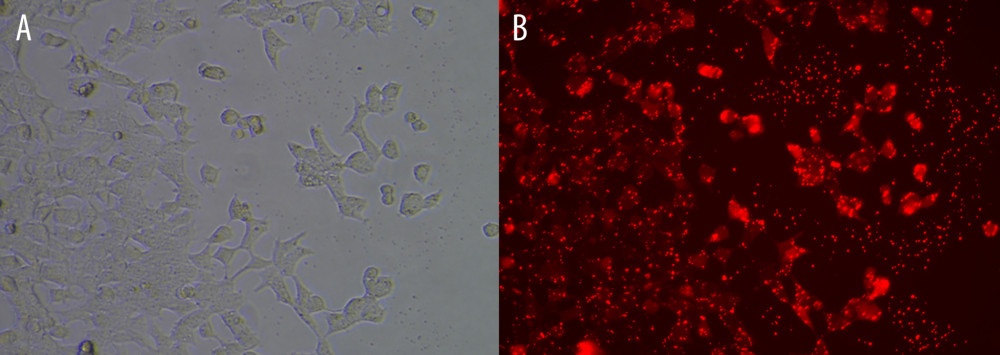 Figure 8. Cell transfection efficiency. (A) Before transfection; (B) After transfection. The figure was created using Olympus CKX53-FL manufactured by Olympus Corporation.
 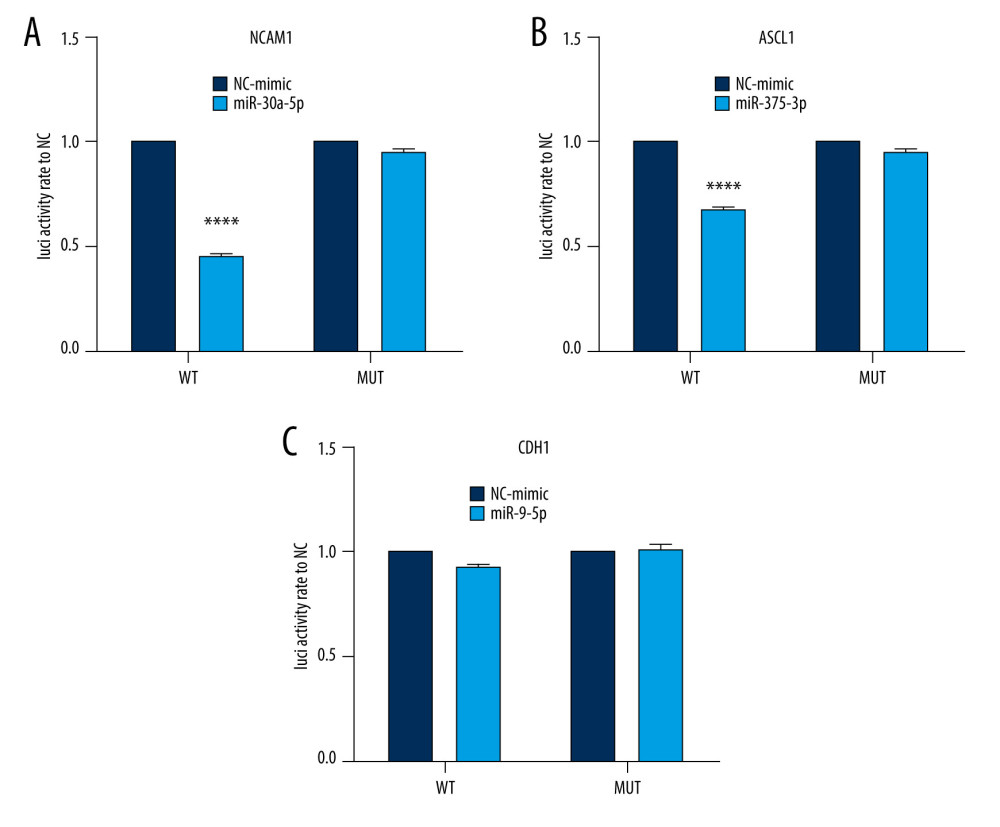 Figure 9. Interaction between selected miRNA-mRNA pairs identified by luciferase reporter assays. (A) Luciferase assay of mmu-miR-30a-5p-Ncam1. (B) Luciferase assay of mmu-miR-375-3p-Ascl1. (C) Luciferase assay of mmu-miR-9-5p-Cdh1. **** P<0.0001. Data were analyzed and visualized using the software GraphPad Prism, version 8.0, supported by GraphPad Software.
 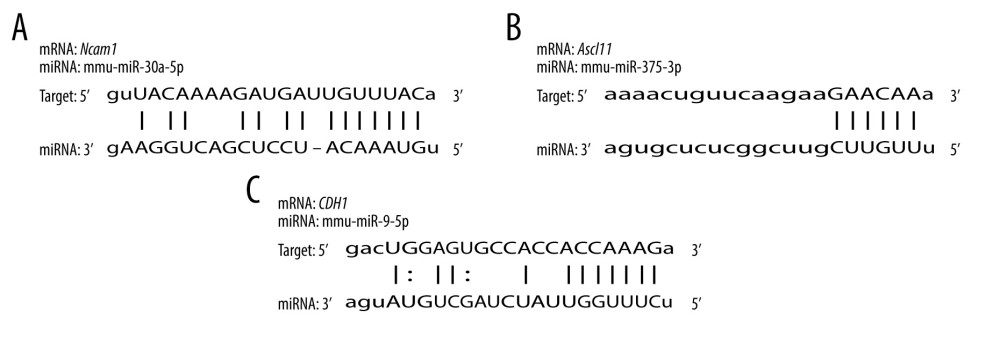 Figure 10. Sequence alignments of miRNAs and target mRNAs. (A) mmu-miR-30a-5p and Ncam1. (B) mmu-miR-375-3p and Ascl1. (C) mmu-miR-9-5p and Cdh1. Predicted by StarBase V2.0, which is an open-source software platform. Visualized by PowerPoint, version Microsoft Office Home and Student 2019, supported by Microsoft.
 References
1. Murray MJ, Lessey BA, Embryo implantation and tumor metastasis: Common pathways of invasion and angiogenesis: Semin Reprod Endocrinol, 1999; 17(3); 275-90
2. Pierce GB, The cancer cell and its control by the embryo. Rous-Whipple Award lecture: Am J Pathol, 1983; 113(1); 117-24
3. Mishra PR, Barik M, Mahapatra AK, Molecular genetics involved in neural tube defects: Recent advances and future prospective for molecular medicine: Neurol India, 2020; 68(5); 1144-50
4. Wolujewicz P, Steele JW, Kaltschmidt JA, Unraveling the complex genetics of neural tube defects: From biological models to human genomics and back: Genesis, 2021; 59(11); e23459
5. Nikolopoulou E, Galea GL, Rolo A, Neural tube closure: Cellular, molecular and biomechanical mechanisms: Development, 2017; 144(4); 552-66
6. Shparberg RA, Glover HJ, Morris MB, Modeling mammalian commitment to the neural lineage using embryos and embryonic stem cells: Front Physiol, 2019; 10; 705
7. Barnholtz-Sloan JS, Ostrom QT, Cote D, Epidemiology of brain tumors: Neurol Clin, 2018; 36(3); 395-419
8. Steiner HH, Herold-Mende C, Bonsanto M, [Prognosis of brain tumors: Epidemiology, survival time and clinical course]: Versicherungsmedizin, 1998; 50(5); 173-79 [in Grerman]
9. Zhu Y, Parada LF, The molecular and genetic basis of neurological tumours: Nat Rev Cancer, 2002; 2(8); 616-26
10. Agnihotri S, Burrell KE, Wolf A, Glioblastoma, a brief review of history, molecular genetics, animal models and novel therapeutic strategies: Arch Immunol Ther Exp (Warsz), 2013; 61(1); 25-41
11. Freyer DR, Hutchinson RJ, McKeever PE, Primary primitive neuroectodermal tumor of the spinal cord associated with neural tube defect: Pediatr Neurosci, 1989; 15(4); 181-87
12. Daltveit DS, Klungs⊘yr K, Engeland A, Cancer risk in individuals with major birth defects: Large Nordic population-based case-control study among children, adolescents, and adults: BMJ, 2020; 371; m4060
13. Wang F, Xu C, Reece EA, Protein kinase C-alpha suppresses autophagy and induces neural tube defects via miR-129-2 in diabetic pregnancy: Nat Commun, 2017; 8; 15182
14. Stupp R, Hegi ME, Mason WP, Effects of radiotherapy with concomitant and adjuvant temozolomide versus radiotherapy alone on survival in glioblastoma in a randomised phase III study: 5-year analysis of the EORTC-NCIC trial: Lancet Oncol, 2009; 10; 459-66
15. Franceschi E, Minichillo S, Brandes AA, Pharmacotherapy of glioblastoma: Established treatments and emerging concepts: CNS Drugs, 2017; 31(8); 675-84
16. Mendrysa SM, Ghassemifar S, Malek R, p53 in the CNS: Perspectives on development, stem cells, and cancer: Genes Cancer, 2011; 2(4); 431-42
17. Toepoel M, Joosten PHLJ, Knobbe CB, Haplotype-specific expression of the human PDGFRA gene correlates with the risk of glioblastomas: Int J Cancer, 2008; 123(2); 322-29
18. Shen F, Song C, Liu Y, IGFBP2 promotes neural stem cell maintenance and proliferation differentially associated with glioblastoma subtypes: Brain Res, 2019; 1704; 174-86
19. Ramya S, Shyamasundar S, Bay BH, Dheen ST, Maternal diabetes alters expression of microRNAs that regulate genes critical for neural tube development: Front Mol Neurosci, 2017; 10; 237
20. Singh SV, Dakhole AN, Deogharkar A, Restoration of miR-30a expression inhibits growth, tumorigenicity of medulloblastoma cells accompanied by autophagy inhibition: Biochem Biophys Res Commun, 2017; 491(4); 946-52
21. Wei X, Li H, Miao J, miR-9*- and miR-124a-Mediated switching of chromatin remodelling complexes is altered in rat spina bifida aperta: Neurochem Res, 2013; 38(8); 1605-15
22. Zottel A, Šamec N, Kump A, Analysis of miR-9-5p, miR-124-3p, miR-21-5p, miR-138-5p, and miR-1-3p in glioblastoma cell lines and extracellular vesicles: Int J Mol Sci, 2020; 21(22); 8491
23. Tian FX, Ma HF, Zhang Q, Identification of mir-9 in glioma diagnosis and prognosis: Clin Lab Jul 1, 2020; 66(7); 190914
24. Wu LN, Wei XW, Fan Y, Altered expression of 14-3-3ζ protein in spinal cords of rat fetuses with spina bifida aperta: PLoS One; 8(8); e70457-2013
25. Li GF, Cheng YY, Li BJ, miR-375 inhibits the proliferation and invasion of glioblastoma by regulating Wnt5a: Neoplasma, 2019; 66(3); 350-56
26. Piñero J, Queralt-Rosinach N, Bravo À, DisGeNET: A discovery platform for the dynamical exploration of human diseases and their genes: Database (Oxford), 2015; 2015; bav028
27. Piñero J, Ramírez-Anguita JM, Saüch-Pitarch J, The DisGeNET knowledge platform for disease genomics: 2019 update: Nucleic Acids Res, 2020; 48(D1); D845-55
28. Yu J, Mu J, Guo Q, Transcriptomic profile analysis of mouse neural tube development by RNA-Seq: IUBMB Life, 2017; 69(9); 706-19
29. Hong Z, Xiang L, Wan-I L, Brain stem global gene expression profiles in human spina bifida embryos: Neural Regen Res, 2011; 6(5); 366-72
30. Szklarczyk D, Gable AL, Nastou KC, The STRING database in 2021: Customizable protein-protein networks, and functional characterization of user-uploaded gene/measurement sets: Nucleic Acids Res, 2021; 49(D1); D605-12
31. Shannon P, Markiel A, Ozier O, Cytoscape: A software environment for integrated models of biomolecular interaction networks: Genome Res, 2003; 13(11); 2498-504
32. Chin CH, Chen SH, Wu HH, cytoHubba: Identifying hub objects and sub-networks from complex interactome: BMC Syst Biol, 2014(Suppl 4); S11
33. Li JH, Liu S, Zhou H, starBase v2.0: Decoding miRNA-ceRNA, miRNA-ncRNA and protein-RNA interaction networks from large-scale CLIP-Seq data: Nucleic Acids Res, 2014; 42(Database issue); D92-97
34. Zhang J, Yang L, Yu J, Alteration of the microRNA expression profile and identification of miRNA/mRNA negative regulation pairs in neural tube defects: Acta Biochim Biophys Sin (Shanghai), 2019; 51(7); 761-65
35. Gebert LFR, MacRae IJ, Regulation of microRNA function in animals: Nat Rev Mol Cell Biol, 2019; 20(1); 21-37
36. Alvarez-Ochoa E, Froldi F, Cheng LY, Interorgan communication in development and cancer: Wiley Interdiscip Rev Dev Biol, 2021; 10(4); e394
37. Patra SK, Roles of OCT4 in pathways of embryonic development and cancer progression: Mech Ageing Dev, 2020; 189; 111286
38. Lagopati N, Belogiannis K, Angelopoulou A, Non-canonical functions of the ARF tumor suppressor in development and tumorigenesis: Biomolecules, 2021; 11(1); 86
39. Coorens THH, Treger TD, Al-Saadi R, Embryonal precursors of Wilms tumor: Science, 2019; 366(6470); 1247-51
40. Coorens THH, Oliver TRW, Sanghvi R, Inherent mosaicism and extensive mutation of human placentas: Nature, 2021; 592(7852); 80-85
41. Sharma A, Seow JJW, Dutertre CA, Onco-fetal reprogramming of endothelial cells drives immunosuppressive macrophages in hepatocellular carcinoma: Cell, 2020; 183(2); 377-94
42. Lupo PJ, Schraw JM, Desrosiers TA, Association between birth defects and cancer risk among children and adolescents in a population-based assessment of 10 million live births: JAMA Oncol, 2019; 5(8); 1150-58
43. Daltveit DS, Klungs⊘yr K, Engeland A, Cancer risk in individuals with major birth defects: Large Nordic population based case-control study among children, adolescents, and adults: BMJ, 2020; 371; m4060
44. Deak KL, Boyles AL, Etchevers HC, SNPs in the neural cell adhesion molecule 1 gene (NCAM1) may be associated with human neural tube defects: Hum Genet, 2005; 117(2–3); 133-42
45. Jayaram S, Balakrishnan L, Singh M, Identification of a novel splice variant of neural cell adhesion molecule in glioblastoma through proteogenomics analysis: OMICS, 2018; 22(6); 437-48
46. Wang B, Zhang Y, Dong H, Loss of Tctn3 causes neuronal apoptosis and neural tube defects in mice: Cell Death Dis, 2018; 9(5); 520
47. Magnus N, D’Asti E, Garnier D, Brain neoplasms and coagulation: Semin Thromb Hemost, 2013; 39(8); 881-95
48. Loh WT, Dheen ST, Jiang B, Molecular and morphological characterization of neural tube defects in embryos of diabetic Swiss Albino mice: Histol Histopathol, 2011; 26(8); 965-78
49. Vue TY, Kollipara RK, Borromeo MD, ASCL1 regulates neurodevelopmental transcription factors and cell cycle genes in brain tumors of glioma mouse models: Glia, 2020; 68(12); 2613-30
50. Park NI, Guilhamon P, Desai K, ASCL1 reorganizes chromatin to direct neuronal fate and suppress tumorigenicity of glioblastoma stem cells: Cell Stem Cell, 2017; 21(2); 209-24
51. Lu TX, Rothenberg ME, MicroRNA: J Allergy Clin Immunol, 2018; 141(4); 1202-7
52. Shi Y, Duan X, Xu G, A ribosomal DNA-hosted microRNA regulates zebrafish embryonic angiogenesis: Angiogenesis, 2019; 22(2); 211-21
53. Ward NJ, Green D, Higgins J, microRNAs associated with early neural crest development in Xenopus laevis: BMC Genomics, 2018; 19(1); 59
54. DeVeale B, Swindlehurst-Chan J, Blelloch R, The roles of microRNAs in mouse development: Nat Rev Genet, 2021; 22(5); 307-23
55. Lin Y, Zeng Y, Zhang F, Characterization of microRNA expression profiles and the discovery of novel microRNAs involved in cancer during human embryonic development: PLoS One, 2013; 8(8); e69230
56. Kulcenty K, Wroblewska JP, Rucinski M, MicroRNA profiling during neural differentiation of induced pluripotent stem cells: Int J Mol Sci, 2019; 20(15); 3651
57. Yang H, Zhang X, Zhao Y, Downregulation of lncRNA XIST represses tumor growth and boosts radiosensitivity of neuroblastoma via modulation of the miR-375/L1CAM Axis: Neurochem Res, 2020; 45(11); 2679-90
Figures
Figure 1. The intersection genes associated with NTDs and neuroectodermal tumors. Deep pink: Genes associated with NTDs and 6 kinds tumors and their Score_gda were higher than the average; Light pink: Genes associated with NTDs only and their Score_gda were less than the average; Orange: Genes associated with 6 kinds of tumors only and their Score_gda were higher than the average; Blue: Genes associated with 6 kinds of tumors only and their Score_gda were less than the average. This figure was created using PowerPoint, version Microsoft Office Home and Student 2019, supported by Microsoft.Figure 2. Expression of 27 differentially expressed gene in E8.5, E9.5, and E10.5. (A) Heatmap of DGEs’ expression; (B–D) X-axis: Log2 Ratio in E8.5 (RA/Con), Log2 Ratio in E9.5 (RA/Con), Log2 Ratio in E10.5 (RA/Con) respectively, Y-axis: Gene Symbol. Flesh colored: genes with |log2 Ratio|>1 and P value<0.05; light gray: genes with |log2 Ratio|<1 or P value>0.05. These figures were created by an open-source tool RStudio, version 1.1.456.Figure 3. Interactive network of 20 differentially expressed genes. (A) The protein–protein interaction (PPI) network of the DEGs. (B) Hub genes. The PPI network of the DEGs was established through STRING (Search Tool for the Retrieval of Interacting Genes database) website, visualized by Cytoscape, and the hub genes were explored using the CytoHubba plug-in, version 3.42, which is an open-source software platform.Figure 4. Differential expression of miRNA-mRNA pairs in E9.5 and E10.5. (A) mmu-miR-30a-5p-Ncam1; (B) mmu-miR-375-3p-Ascl1; (C) mmu-miR-9-5p-Cdh1; Gray: Control; Red: Upregulated in NTDs; Green: Downregulated in NTDs. n=3,* P<0.05, ** P<0.01, *** P<0.001. Data were analyzed and visualized using the software GraphPad Prism, version 8.0, supported by GraphPad Software.Figure 5. The expression of candidate genes in E9.5. Gray: Control; Red: Upregulated in NTDs; Green: Downregulated in NTDs. n=3,* P<0.05, ** P<0.01, *** P<0.001. Data were analyzed and visualized using the software GraphPad Prism, version 8.0, supported by GraphPad Software.Figure 6. The expression of candidate genes in E10.5. Gray: Control; Red: Up-regulated in NTDs; Green: Downregulated in NTDs. n=3,* P<0.05, ** P<0.01, *** P<0.001. Data were analyzed and visualized using GraphPad Prism, version 8.0, supported by GraphPad Software.Figure 7. The expression of candidate genes in GBM samples. (A) NCAM1. (B) CDH1. (C) SHH. (D) ASCL1. n=10,* P<0.05, ** P<0.01, *** P<0.001, ns – not significant. Data were analyzed and visualized using GraphPad Prism, version 8.0, supported by GraphPad Software.Figure 8. Cell transfection efficiency. (A) Before transfection; (B) After transfection. The figure was created using Olympus CKX53-FL manufactured by Olympus Corporation.Figure 9. Interaction between selected miRNA-mRNA pairs identified by luciferase reporter assays. (A) Luciferase assay of mmu-miR-30a-5p-Ncam1. (B) Luciferase assay of mmu-miR-375-3p-Ascl1. (C) Luciferase assay of mmu-miR-9-5p-Cdh1. **** P<0.0001. Data were analyzed and visualized using the software GraphPad Prism, version 8.0, supported by GraphPad Software.Figure 10. Sequence alignments of miRNAs and target mRNAs. (A) mmu-miR-30a-5p and Ncam1. (B) mmu-miR-375-3p and Ascl1. (C) mmu-miR-9-5p and Cdh1. Predicted by StarBase V2.0, which is an open-source software platform. Visualized by PowerPoint, version Microsoft Office Home and Student 2019, supported by Microsoft. Tables
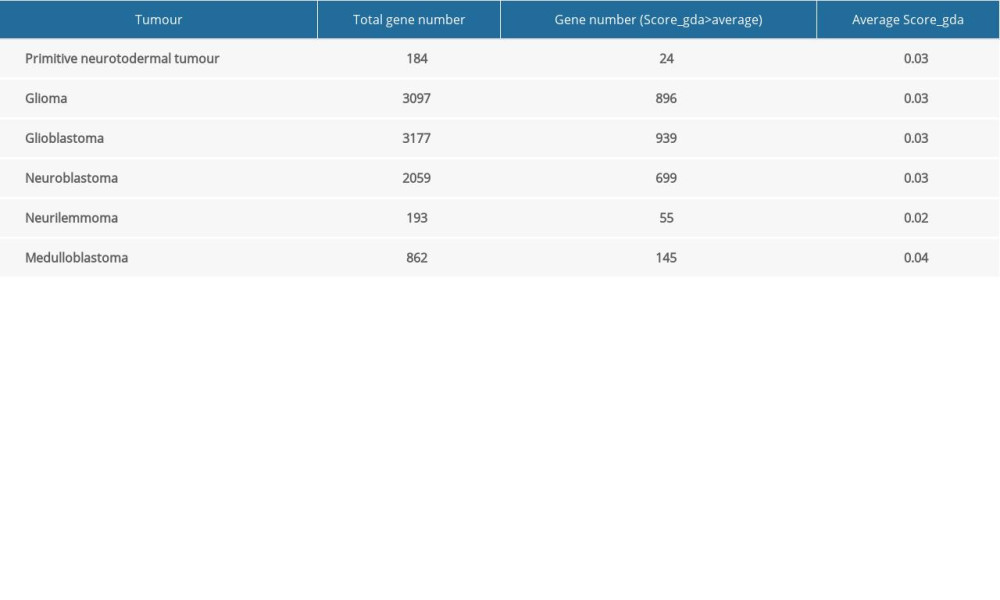 Table 1. Total number of genes related with 6 kinds of cancer and the number of genes with score greater than the mean value.Table 1. Total number of genes related with 6 kinds of cancer and the number of genes with score greater than the mean value.
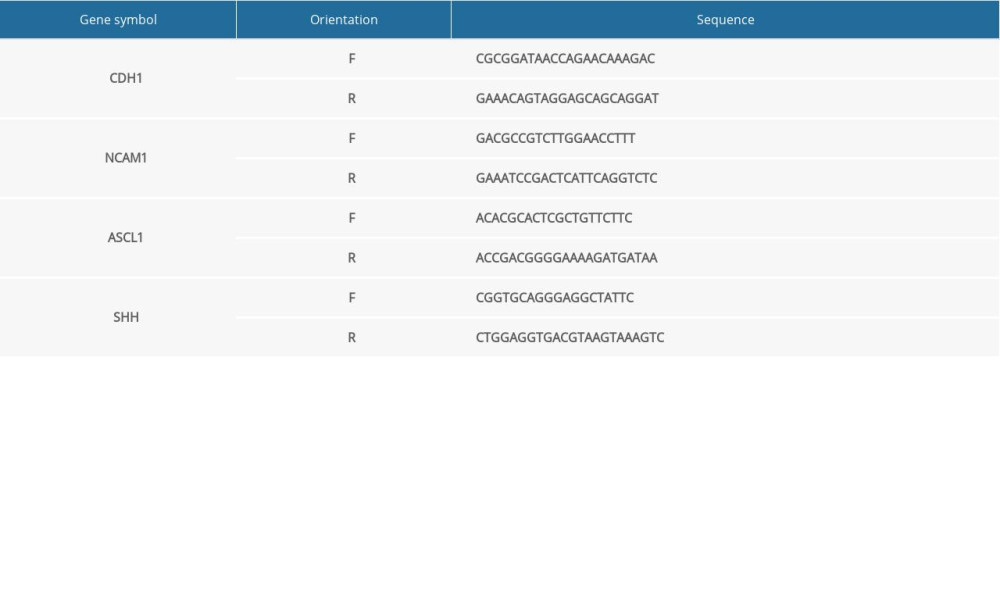 Supplementary Table 1. Primer sequences (for RT-qPCR in NTDs mice).
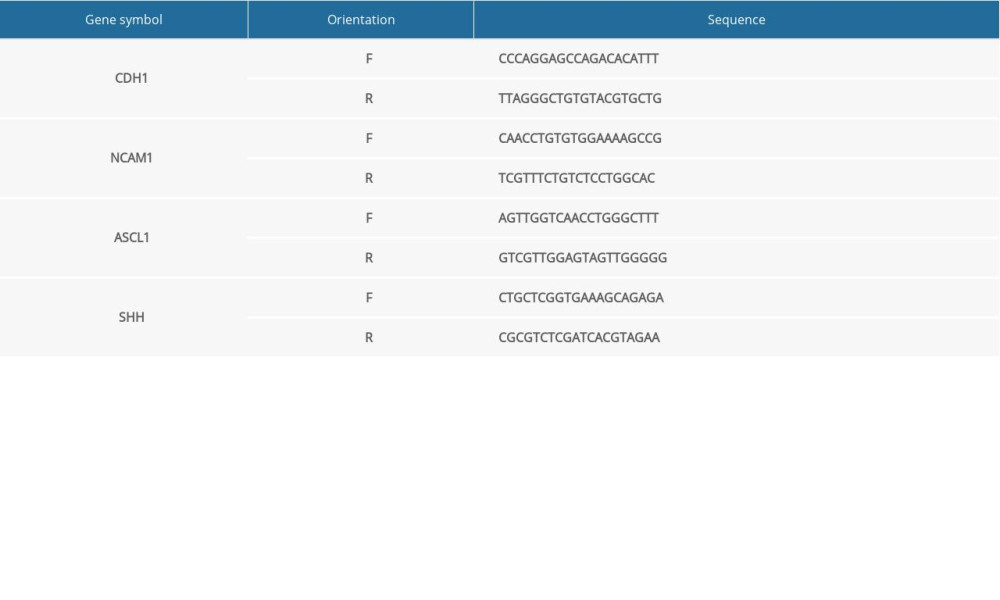 Supplementary Table 2. Primer sequences (for RT-qPCR in GBM samples).
 In Press
06 Mar 2024 : Clinical Research
Prevalence and Variation of Medical Comorbidities in Oral Surgery Patients: A Retrospective Study at Jazan ...Med Sci Monit In Press; DOI: 10.12659/MSM.943884
08 Mar 2024 : Clinical Research
Evaluation of Foot Structure in Preschool Children Based on Body MassMed Sci Monit In Press; DOI: 10.12659/MSM.943765
15 Apr 2024 : Laboratory Research
The Role of Copper-Induced M2 Macrophage Polarization in Protecting Cartilage Matrix in OsteoarthritisMed Sci Monit In Press; DOI: 10.12659/MSM.943738
07 Mar 2024 : Clinical Research
Knowledge of and Attitudes Toward Clinical Trials: A Questionnaire-Based Study of 179 Male Third- and Fourt...Med Sci Monit In Press; DOI: 10.12659/MSM.943468
Most Viewed Current Articles
17 Jan 2024 : Review article
Vaccination Guidelines for Pregnant Women: Addressing COVID-19 and the Omicron VariantDOI :10.12659/MSM.942799
Med Sci Monit 2024; 30:e942799
14 Dec 2022 : Clinical Research
Prevalence and Variability of Allergen-Specific Immunoglobulin E in Patients with Elevated Tryptase LevelsDOI :10.12659/MSM.937990
Med Sci Monit 2022; 28:e937990
16 May 2023 : Clinical Research
Electrophysiological Testing for an Auditory Processing Disorder and Reading Performance in 54 School Stude...DOI :10.12659/MSM.940387
Med Sci Monit 2023; 29:e940387
01 Jan 2022 : Editorial
Editorial: Current Status of Oral Antiviral Drug Treatments for SARS-CoV-2 Infection in Non-Hospitalized Pa...DOI :10.12659/MSM.935952
Med Sci Monit 2022; 28:e935952