13 October 2022: Clinical Research
Effects of Hemodilution on Clot Waveform Analysis Parameters, Clotting Factors, and Thrombin Generation Assays in a Dilutional Model Based on Analysis of 11 Healthy Male Blood Donors
Junko Ichikawa1ABCDEG*, Ryota Okazaki2BC, Tomoki Fukuda2B, Daejoon Yoon2B, Makiko Komori2DGDOI: 10.12659/MSM.937368
Med Sci Monit 2022; 28:e937368


Abstract
BACKGROUND: Clot wave analysis (CWA) during activated partial thromboplastin time (aPTT) measures the speed and extent of fibrin polymerization in the plasma. This study aimed to evaluate the effects of hemodilution on CWA parameter, clotting factors, and thrombin generation assays in a dilutional model.
MATERIAL AND METHODS: Platelet-poor plasma obtained from 11 healthy male volunteers was diluted with 0.9% sodium chloride by 10-80% to analyze coagulation profiles, CWA, clotting factors, and thrombin generation assays. CWA includes 5 parameters: the time-dependent variable (aPTT), rate/acceleration (min1, min2, and max2), and magnitude of signal change (delta).
RESULTS: Critically low activities of 30% for clotting factors and 100 mg/dl of fibrinogen were determined at dilutions of 70% and 60%, respectively. Peak thrombin and endogenous thrombin potential were significantly lower compared with baseline after 50% and 80% dilution, respectively. aPTT did not correlate with the decrease in the clotting factors up to dilutions of 50% and subsequently became abnormal values. As the change in rate/acceleration parameters parallels the time course of clotting factor activity in a dilution-dependent linear manner, these parameters indicate an intervention threshold at critically low activities of clotting factors. The strongest correlations were observed between clotting factors and aPTT, clotting factors and min2, delta and peak thrombin (r=0.95), and delta and fibrinogen (r=0.98).
CONCLUSIONS: aPTT was significantly correlated with clotting factors, while the rate/acceleration parameters and delta changed with variation in thrombin and fibrinogen generation. These findings may help in evaluating coagulability.
Keywords: Blood Coagulation Factors, Blood Coagulation Tests, Partial Thromboplastin Time, Thrombin, Blood Donors, Fibrin, Fibrinogen, Hemodilution, Humans, Male, Sodium Chloride
Background
Dilutional coagulopathy is inevitable after massive hemorrhage and fluid replacement to maintain normovolemia and is related to multifactorial changes in cellular components and coagulation factors that affect thrombin generation, clot firmness, and fibrinolysis [1]. Therefore, accurate assessment of blood coagulation in vitro is essential for optimal hemostatic intervention. Conventional activated partial thromboplastin time (aPTT)-based clotting assays are useful for routine laboratory analysis; however, aPTT terminates with endpoints occurring when less than 5% of thrombosis formation is completed [2] and might not reflect the overall stability of a hemostatic thrombus.
Clot waveform analysis (CWA), a global coagulation test, is based on the continuous observation of change in light transmittance or absorbance due to fibrin formation during the aPTT assay [3.4]. CWA parameters are defined by a slope in the waveform and reflect the speed and extent of fibrin polymerization during the entire process of clot formation and lysis [3–5]. The sigmoidal extinction curve obtained during aPTT assays includes 5 parameters: (1) timing of the point of inflection of the curve (aPTT), (2, 3, 4) the rate/acceleration for changes in transmittance with respect to time (the minimum value of the first derivative [min1], the minimum value of the second derivative (min2), maximum peaks of the second derivative [max2]), and (5) total difference of transmittance (delta) [3].
Past studies have suggested that this technique provides useful information for determining the clinical phenotype of patients with hemophilia with significantly low factor levels [6–8] and detecting disseminated intravascular coagulation earlier than conventional methods with high specificity (97.6%) and sensitivity (98%) [9,10]. Moreover, the assay identifies the degree of hypercoagulability and may help identify patients at high risk of thromboembolism [11,12]. CWA could also provide a novel method for monitoring hemostasis in cases of replacement therapy for serious hemorrhage and for monitoring antithrombic therapy to clarify therapeutic efficacy and bleeding risk [13,14].
Measuring thrombin generation by calibrated automated thrombography is also a comprehensive coagulation assays and reflects the overall function of the blood clotting system [15]. A previous study investing the correlation between thrombin generation and clinical outcome of patients has demonstrated that thrombin generation is an accurate marker of bleeding [16] and treatment response to thrombin-boosting bypassing agents, activated prothrombin complex concentrate, or recombinant factor VIIa [17,18]. This technique evaluates the balance between procoagulant and anticoagulant forces and provides the endogenous capacity of the overall hemostatic potential [19,20]. Therefore, this study aimed to evaluate the effects of hemodilution on CWA parameters, clotting factors, and thrombin generation assays in a dilutional model based on analysis of 11 healthy male volunteers.
Material and Methods
PARTICIPANTS:
This study was approved by the Institutional Review Board of Tokyo Women’s Medical University (No. 5751), and written informed consent was obtained from 11 healthy male volunteers. Whole blood was taken from the participants with a mean age of 33.8 (15) years (height, 172.4±3.5 cm; weight, 61.2±4.8 kg) and collected into plastic tubes containing 3.2% sodium citrate (Venoject II; Terumo Corporation, Tokyo, Japan). All participants had a normal history of coagulation and renal and hepatic function and denied taking any medications within the previous 14 days. Platelet-poor plasma (PPP) was obtained after centrifugation of citrated whole blood for 20 min at 2000×g. All coagulation factors, including aPTT of undiluted blood samples, were in the normal range and were used for baseline measurement.
CONDUCT OF THE STUDY:
Dilutional coagulopathy was simulated by diluting PPP with 0.9% sodium chloride solution (saline) (Braun, Melsungen, Germany) (n¼10) as follows: 0% (baseline), 10%, 20%, 30%, 40%, 50%, 60%, 70%, and 80%. Subsequently, CWA and laboratory measurements were performed. Preliminary tests showed that saline had a negligible influence on pH in our setting. Additionally, the solution was calcium-free to avoid early initiation of coagulation.
LABORATORY MEASUREMENTS:
Coagulation profiles, including prothrombin time using Thromborel S (Sysmex Co., Kobe, Japan), aPTT, prothrombin time-international normalized ratio, fibrinogen level (Clauss method) using Thrombocheck (Sysmex Co., Kobe, Japan), and antithrombin (AT) activity using Revohem AT (Sysmex Co., Kobe, Japan), were analyzed in the central hematological laboratory using XN-3000 (Sysmex Co., Kobe, Japan) according to the institutional protocol. Clotting factors II, VIII, IX, and X were determined by CS-5100 (Sysmex, Kobe, Japan) using Thromborel S, Pathromtin SL, Pathromtin SL, and Thromborel S, respectively (Siemens Healthineers, Marburg, Germany). All clotting factors were measured using a one-stage clotting assay in individual factor-deficient plasma (Siemens Healthineers, Marburg, Germany).
CLOT WAVEFORM ANALYSIS:
The aPTT-CWA was performed on a CS-5100 device (Sysmex, Kobe, Japan) using Thrombocheck aPTT-SLA (Sysmex, Kobe, Japan), a commercially available aPTT reagent consisting of synthetic phospholipids and ellagic acid. CWA is an automated optical detection system that performs routine clinical clotting assays to quantify light transmittance changes [3,4]. The first derivative of the transmittance represents the coagulation velocity, which reflects the conversion of fibrinogen to a fibrin clot [3,4]. The second derivative of the transmittance data reflects the acceleration and deceleration of the reaction [3,4]. The parameters examined by the clot waveform were as follows: (i) min1, an indicator of the maximum velocity of coagulation achieved; (ii) min2, an index of the maximum acceleration of the reaction achieved; (iii) max2, a reflection of maximum deceleration of the reaction achieved; and (iv) the maximum density of the clot (Delta), which is the total difference in the transmittance level.
THROMBIN GENERATION ASSAYS:
The assays were performed using the calibrated automated thrombogram technique as originally described [15]. Briefly, 20 μl of PPP was added to a microtiter plate well, followed by 20 μl of 1 pM tissue factor (TF)-based activator (PPP reagent: final concentration, 5 pM TFs [15,21] with 4 μM phospholipid). The plate was incubated for 10 min at 37°C, and then, 20 μl of 100 mM calcium chloride and 5 mM fluorogenic substrate Z-Gly-Gly-Arg-AMC were dispensed into each well to start the reaction. The development of fluorescent signals was monitored at 20-s intervals for 120 min using a Fluoroskan Ascent microplate reader (Thermo Fisher Scientific Co., Waltham, MA) with 390 nm excitation and 460 nm emission filter. Thrombin generation (nM) was calculated from fluorescent signals corrected with reference to thrombin calibrator samples.
The lag time (time to 1/6th of the thrombin peak, min), time to thrombin peak (min), peak thrombin level (nM), and endogenous thrombin potential (ETP, the area under the thrombin curve, nM×minute) of thrombin generation were obtained using Thrombinoscope software (Thrombinoscope B.V., Maastricht, the Netherlands). The area under the curve (total ETP) was calculated as the sum of the trapezoidal areas of the values between the start and end of the measurement. ETP was separated into 2 segments representing the procoagulant phase (ETPp) before the peak of thrombin generation and the inhibitory phase (ETPi) after the peak [22]. Briefly, ETPp was calculated by integrating the area under the curve up to the peak and then subtracting that from the total to give ETPi.
STATISTICAL ANALYSES:
Data were tested for normal distribution using the Shapiro-Wilk test. Changes in aPTT-dependent clotting factors, CWA parameters, coagulation profiles, and thrombin generation assay values between baseline and 10–80% after hemodilution were compared using repeated measures one-way analysis of variance. Pearson’s correlation coefficients were determined between CWA parameters and thrombin generation assay variables and between CWA parameters and coagulation profiles. The criterion for rejection of the null hypothesis was
Results
Figure 1 depicts the effect of hemodilution on aPTT-CWA parameters; aPTT-dependent clotting factors II, VIII, IX, X, and fibrinogen; and thrombin generation assay parameters. All undiluted baseline values of fibrinogen, aPTT, and clotting factor activities were within the normal ranges. There was a dilution-dependent linear decrease in all 4 coagulation factors (Figure 1). aPTT was increased by hemodilution in a non-linear fashion (Figure 1). aPTT did not correlate with the decrease in clotting factors up to dilutions of 50–60% and subsequently became pathological at this point, with remaining activities of clotting factors of approximately 45%, far from an intervention threshold. aPTT values corresponding to a clotting factor activity of approximately 20% and 30% were 93.1 (16.1) s and 150.7 (22.6) s, respectively.
Min1, min2, and max2 decreased in a dilution-dependent linear manner, whereas delta values decreased in a dilution-dependent non-linear manner (Figure 1). After 60% dilution, all factor activities were below the lower limit of the reference range (−45.7 to −57% change from baseline) with a corresponding mean aPTT from 32.8 to 62.3 ([s] +89% change from baseline), min1 from 3.25 to 0.86 ([%s] – 79.2%), min2 from 0.48 to 0.1 ([%/S2] – 81.6%), max2 from 0.38 to 0.07 ([%/S3] – 57%), and delta change\ from 39.8 to 17.1 ([%] 43.0%). At a dilution of 70%, all factors reached a remaining critically low activity of 30% as a guide for fresh frozen plasma transfusion.
There was a dilution-dependent decrease in peak thrombin concentrations, slightly decreased ETP values, and no remarkable changes in lag time and time to thrombin peak. Peak thrombin generation was significantly decreased by 27.1% after 50% dilution (
Fibrinogen decreased in a linear manner with dilution and first reached its lower physiological value of 150 mg/dl at a dilution of approximately 40% (Figure 1) with a corresponding average aPTT 42.8 (s), min1 1.68 (%s), min2 0.24 (%/S2), max2 0.17 (%/S3), and delta 22.7 (%). A critical low level of fibrinogen (100 mg/dl) was finally reached after a dilution of approximately 60%, although no critical reduction in other coagulation factors was observed.
The correlations between aPTT-CWA variables and coagulation factors, fibrinogen, and thrombin generation assay parameters are presented in Table 1. CWA parameters (excluding aPTT) showed the strongest correlation with fibrinogen (
Discussion
In this study, both the timing and rate/acceleration parameters were strongly correlated with the coagulation factors in the dilutional plasma samples. The significant correlation between CWA parameters other than aPTT and peak thrombin generation and/or ETP in this study suggests that the clot waveform profile reflects the rate and amount of thrombin generation, whereas aPTT did not show any correlation with thrombin generation assay parameters.
aPTT became pathological at the point where hemostasis was still not required and tended to show proportionally larger changes at a dilution of 60–80%, suggesting that they may have difficulty in identifying moderate timing and the amounts of blood components for transfusion [23]. However, as the change of rate/acceleration parameters parallels the time course of clotting factor activity, min1, min2, and max 2 indicate an intervention threshold at critically low activities of clotting factors (20–30%). Thus, rate/acceleration-based CWA values might be a helpful parameter for estimating clotting factor activity during bleeding, which is consistent with the results of previous studies [6–8].
aPTT is determined as the time at which the intensity of the transmitted light starts to decrease. This is the point at which coagulation is initiated and measures the transition from procoagulation to activated coagulation, which is highly associated with the appearance of the first visible fibrin strands. Because fibrin crosslinking occurs after the endpoint of aPTT [2,24], rate/acceleration-based parameters may vary independent of the timing parameters.
CWA demonstrates a sigmoidal extinction curve during clot formation, which starts to decrease due to fibrin polymerization. As the coagulation cascade progresses, thrombin generated depending on the available concentrations of pro- and anticoagulants mediates the cleavage of fibrinogen to fibrin. As fibrin is the ultimate substrate for thrombin in the coagulation cascade, it is likely that clot waveforms also reflect thrombin generation, which agrees with the result of past studies [14,25]. However, we showed a stronger correlation between CWA parameters and peak thrombin and a weaker correlation between CWA parameters and ETP, as compared to the result of the study by Cheong et al. This discrepancy could be attributed to a sustained total amount of thrombin caused by the decrease in AT relative to procoagulant levels after hemodilution.
In this study, at 80% dilution, the peak of thrombin generation was decreased by 36% relative to baseline, whereas the ETP decreased less, staying at 83% relative to baseline, which was in agreement with the result of a previous study showing that ETP values remain relatively stable at dilutions up to 95% [26]. When the rates of thrombin production and thrombin inhibition reach equilibrium, the thrombin generation profile creates a peak. This suggests that the rates of both thrombin production and inhibition were reduced in a hemodilution-dependent manner. However, our data demonstrated that the total amount of free thrombin measured remains relatively well preserved. Previous studies have demonstrated that reduced AT activity increases the half-life of factor Xa and thrombin in vivo; thus, thrombin generation patterns are relatively normal despite lower procoagulant factor levels [27–29]. The decrease in AT relative to procoagulant levels after hemodilution slows down the inhibition of procoagulant proteases, which was confirmed by the imbalance of ETPp and ETPi in thrombin generation curves. In this study, the extensive decrease in ETPp relative to ETPi after hemodilution indicates slow thrombin inhibition due to reduced AT levels in ETPi and contributes to the preservation of ETP over the control. Generally, the peak amount of thrombin diminishes with decreasing clotting factor concentrations before the ETP begins to decrease. In a previous study, a clinical bleeding tendency was observed when thrombin generation fell below 20% of the normal range [30,31]. These studies indicate that thrombin generation after 80% dilution might be sufficient to achieve adequate hemostasis in this in vitro study.
The amplitude of CWA curve, characterized by Delta, is determined by the turbidity resulting from the aggregation of fibrin monomers and shows a linear association with fibrinogen concentration. Other studies have also shown that the correlation between fibrinogen and delta was significant, with significantly weaker correlations with other properties [11,32].
The CWA parameters are not exactly equivalent to those derived from thrombin generation because fibrin clot formation measured by CWA using transmitted light based on intrinsic coagulation cascade is different from that measured by thrombin generation assay using fluorescence triggered by a tissue factor [13]. However, the strong correlation of coagulation factor concentration, thrombin generation, and fibrinogen with CWA parameters might be explained by the physiological process of the coagulation cascade. Each CWA parameter reflects the characteristics of the coagulation cascade in sequential steps. Small amounts of thrombin produced in the initiation phase described by aPTT are critical for fully activating factors XI, V, and VIII and platelets into a highly procoagulant state during the amplification phase. Generated thrombin participates in multiple positive feedback loops by activating tenase complex with FVIIIa and prothrombinase complex form with FV [13] leading to a burst of thrombin generation in the propagation phase, which might be partly shown by rate/acceleration parameters. Since sufficient thrombin is required to convert fibrinogen to fibrin, delta associated with the total amount of thrombin and fibrinogen might account for fibrin clot formation. It is not the initiation phase of clotting but the propagation phase that dictates the rate of fibrin clot formation and determines hemostasis and blood loss [19,20]. Therefore, applying this global assay may allow the detection of hemostatic abnormalities in specimens with an apparently normal aPTT, or may facilitate identification of the source of an abnormal aPTT result.
Our study had some limitations. First, our experiments were performed in vitro, excluding rheological elements of coagulation, which may not accurately represent in vivo conditions. Further studies are needed to address the clinical approaches, such as massive hemorrhage related to major trauma and cardiovascular surgery, and their influence on CWA as a useful guide for hemostatic therapy. Second, the sensitivity of thrombin generation assays was dependent on the TF concentration, and thrombin generation was amplified by increasing TF concentrations [33,34]. It is essential to define appropriate TF concentrations for specific hemostatic assessments. A lower dose (1–2 pM) may be suitable for evaluating patients with hemophilia and protein C activation [35]. The 5 pM TF used in our study, which is considered a conventional concentration used for massive bleeding in clinical studies, provides clot times in the range of 4–5 min, which is comparable with in vivo bleeding times [21]. In addition, there are still no standardized analyzers and reagents for CWA assays. We only evaluated the correlations between aPTT-CWA variables and thrombin generation parameters and coagulation factors on a single analyzer and reagent type for CWA assays in an in vitro dilutional coagulopathy. Consequently, our findings may not be generalizable to other type of analyzers and reagents.
Conclusions
The findings from in vitro hemodilution model in healthy male volunteers showed that aPTT was significantly correlated with clotting factors. The rate and acceleration parameters and delta in CWA changed with variation in thrombin and fibrinogen generation. A broader set of CWA parameters might be used for more efficient monitoring of hemostasis.
Figures
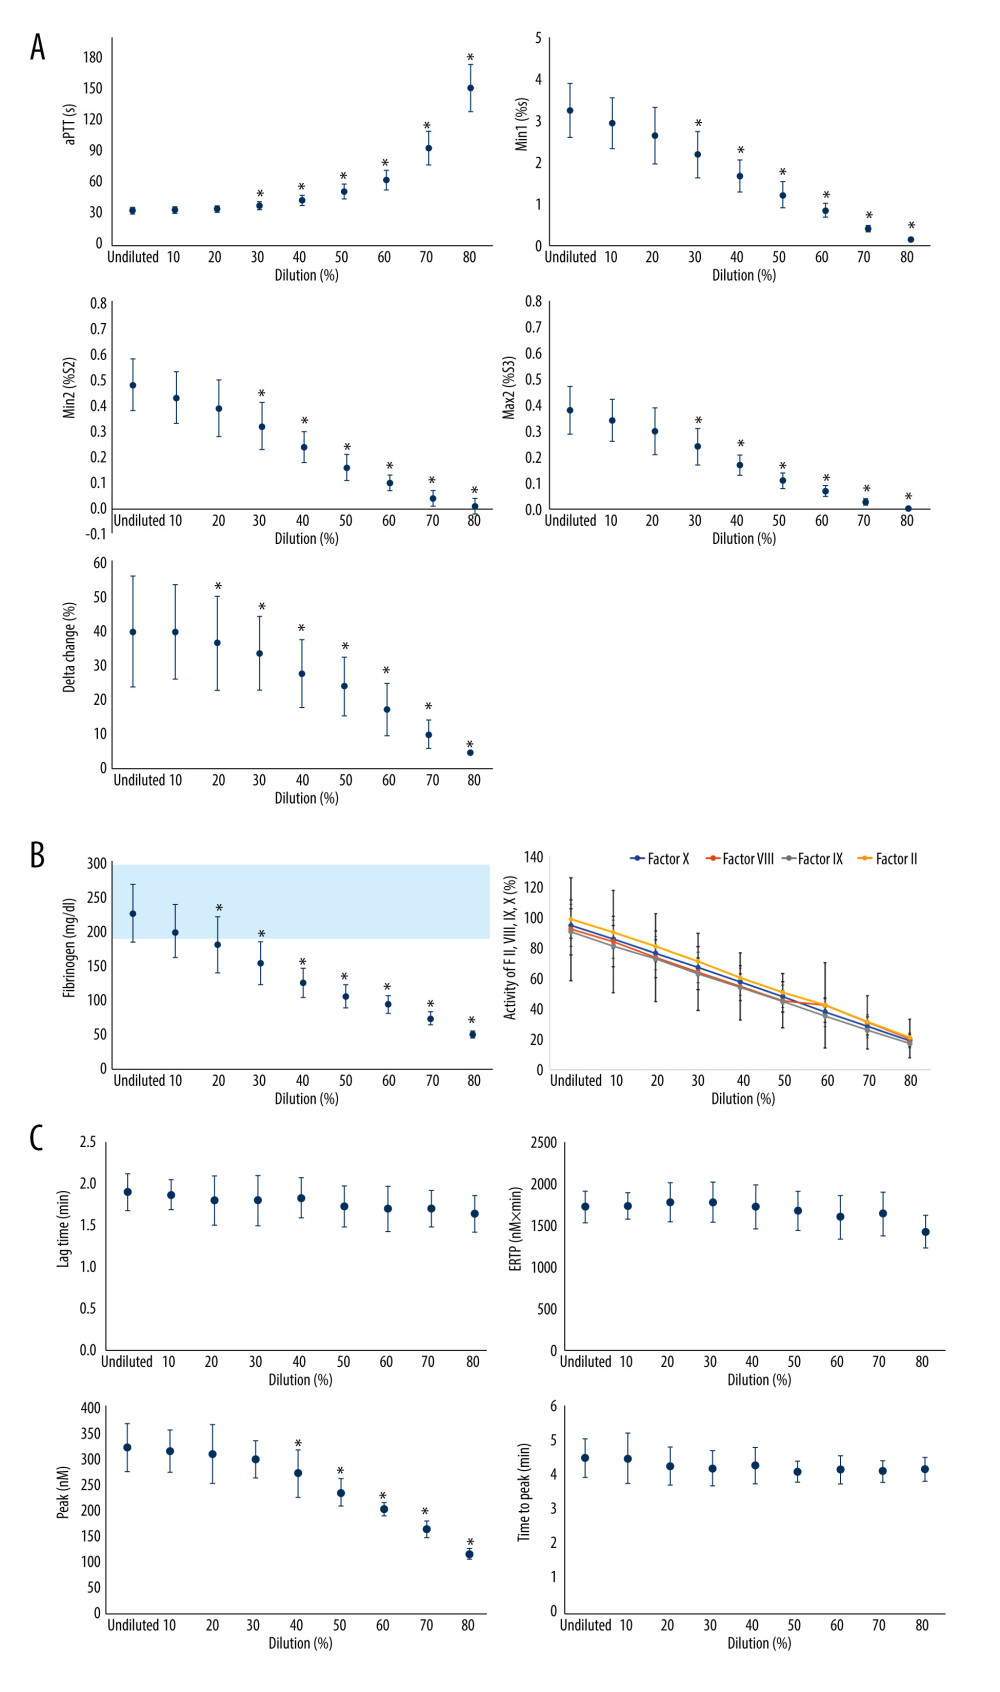 Figure 1. The effect of isovolemic hemodilution with saline on clot waveform parameters (A), aPTT-dependent clotting factors II, VIII, IX, and X and fibrinogen (B), and thrombin generation profiles (C) measured in undiluted and 10–80% diluted plasma from 11 healthy male volunteers. light blue area indicates the normal range for fibrinogen values. P value <0.05 was considered statistically significant with repeated measures two-way analysis of variance. aPTT – activated partial thromboplastin time; Min1 – minimum value of the first derivative; Min2 – minimum value of the second derivative; Max2 – maximum peaks of the second derivative; ETP – endogenous thrombin potential. Min 1 indicates that the maximum velocity of coagulation is achieved. Min2 describes the index of the maximum acceleration of the reaction. Max2 reflects the maximum deceleration of the reaction. Delta is defined as the total difference in transmittance level. * Statistically significant difference from undiluted plasma. Excel (Version 2207, Microsoft) was used for creation of the figure.
 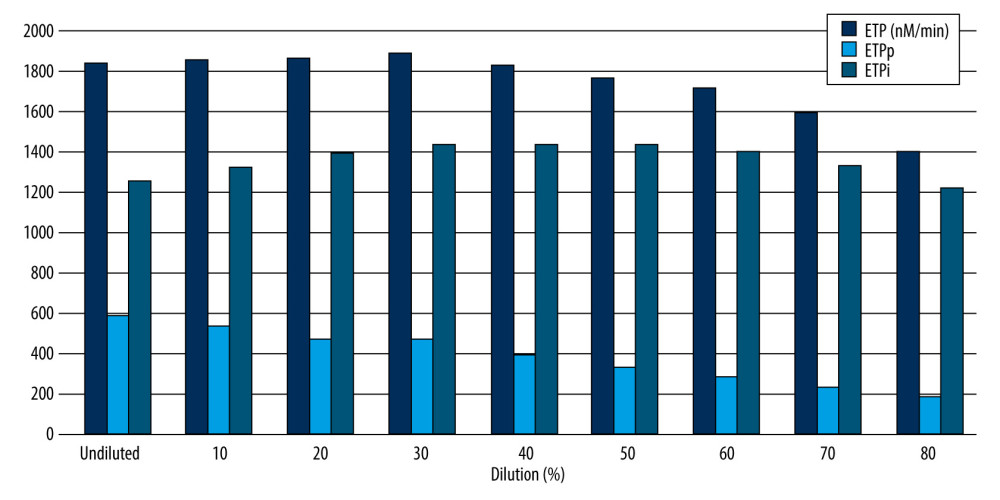 Figure 2. The effect of isovolemic hemodilution with saline on thrombin generation potentials. Endogenous thrombin potential (ETP) was measured in undiluted and 10–80% diluted plasma from 11 healthy male volunteers. P<0.05 was considered statistically significant with repeated measures two-way analysis of variance. nM – nanomolar; min – minute; ETPp – procoagulant endogenous thrombin potential; ETPi – inhibitory endogenous thrombin potential. * Statistically significant difference from undiluted plasma. Excel (Version 2207, Microsoft) was used for creation of the figure.
 References
1. Bolliger D, Görlinger K, Tanaka KA, Pathophysiology and treatment of coagulopathy in massive hemorrhage and hemodilution: Anesthesiology, 2010; 113; 1205-19
2. Mann KG, Brummel K, Butenas S, What is all that thrombin for?: J Thromb Haemost, 2003; 1; 1504-14
3. Braun PJ, Givens TB, Stead AG, Properties of optical data from activated partial thromboplastin time and prothrombin time assays: Thromb Haemost, 1997; 78; 1079-87
4. Shima M, Thachil J, Nair SC, Srivastava AScientific and Standardization Committee, Towards standardization of clot waveform analysis and recommendations for its clinical applications: J Thromb Haemost, 2013; 11; 1417-20
5. Nogami K, Matsumoto T, Sasai K, A novel simultaneous clot-fibrinolysis waveform analysis for assessing fibrin formation and clot lysis in haemorrhagic disorders: Br J Haematol, 2019; 187; 518-29
6. Shima M, Matsumoto T, Fukuda K, The utility of activated partial thromboplastin time (aPTT) clot waveform analysis in the investigation of hemophilia A patients with very low levels of factor VIII activity (FVIII: C): Thromb Haemost, 2002; 87; 436-41
7. Nair SC, Dargaud Y, Chitlur M, Srivastava A, Tests of global haemostasis and their applications in bleeding disorders: Haemophilia, 2010; 16(Suppl 5); 85-92
8. Matsumoto T, Nogami K, Tabuchi Y, Clot waveform analysis using CS-2000i™ distinguishes between very low and absent levels of factor VIII activity in patients with severe haemophilia A: Haemophilia, 2017; 23; e427-35
9. Downey C, Kazmi R, Toh CH, Early identification and prognostic implications in disseminated intravascular coagulation through transmittance waveform analysis: Thromb Haemost, 1998; 80; 65-69
10. Bakhtiari K, Meijers JC, de Jonge E, Levi M, Prospective validation of the International Society of Thrombosis and Haemostasis scoring system for disseminated intravascular coagulation: Crit Care Med, 2004; 32; 2416-21
11. Ichikawa J, Okazaki R, Fukuda T, Evaluation of coagulation status using clot waveform analysis in general ward patients with COVID-19: J Thromb Thrombolysis, 2021; 53(1); 118-22
12. Ruberto MF, Sorbello O, Civolani A, Clot wave analysis and thromboembolic score in liver cirrhosis: two opposing phenomena: Int J Lab Hematol, 2017; 39; 369-74
13. Wakui M, Fujimori Y, Katagiri H, Assessment of in vitro effects of direct thrombin inhibitors and activated factor X inhibitors through clot waveform analysis: J Clin Pathol, 2019; 72; 244-50
14. Cheong MA, Tan CW, Wong WH, A correlation of thrombin generation assay and clot waveform analysis in patients on warfarin: Hematology, 2022; 27; 337-42
15. Hemker HC, Giesen P, Al Dieri R, Calibrated automated thrombin generation measurement in clotting plasma: Pathophysiol Haemost Thromb, 2003; 33; 4-15
16. Bosch YP, Al Dieri R, ten Cate H, Measurement of thrombin generation intra-operatively and its association with bleeding tendency after cardiac surgery: Thromb Res, 2014; 133; 488-94
17. Szlam F, Sreeram G, Solomon C, Elevated factor VIII enhances thrombin generation in the presence of factor VIII-deficiency, factor XI-deficiency or fondaparinux: Thromb Res, 2011; 127; 135-40
18. Franklin SW, Szlam F, Fernandez JD, Optimizing thrombin generation with 4-factor prothrombin complex concentrates in neonatal plasma after cardiopulmonary bypass: Anesth Analg, 2016; 122; 935-42
19. Wolberg AS, Campbell RA, Thrombin generation, fibrin clot formation and hemostasis: Transfus Apher Sci, 2008; 38; 15-23
20. Negrier C, Shima M, Hoffman M, The central role of thrombin in bleeding disorders: Blood Rev, 2019; 38; 100582
21. Brummel-Ziedins KE, Pouliot RL, Mann KG, Thrombin generation: Phenotypic quantitation: J Thromb Haemost, 2004; 2; 281-88
22. Abuelkasem E, Hasan S, Mazzeffi MA, Reduced requirement for prothrombin complex concentrate for the restoration of thrombin generation in plasma from liver transplant recipients: Anesth Analg, 2017; 125; 609-15
23. Weiss G, Lison S, Spannagl M, Heindl B, Expressiveness of global coagulation parameters in dilutional coagulopathy: Br J Anaesth, 2010; 105; 429-36
24. Tanaka KA, Key NS, Levy JH, Blood coagulation: hemostasis and thrombin regulation: Anesth Analg, 2009; 108; 1433-46
25. Matsumoto T, Shima M, Takeyama M, The measurement of low levels of factor VIII or factor IX in hemophilia A and hemophilia B plasma by clot waveform analysis and thrombin generation assay: J Thromb Haemost, 2006; 4; 377-84
26. Gratz J, Schlimp CJ, Honickel M, Sufficient thrombin generation despite 95% hemodilution: an in vitro experimental study: J Clin Med, 2020; 9; 3805
27. Tripodi A, Primignani M, Lemma L, Detection of the imbalance of procoagulant versus anticoagulant factors in cirrhosis by a simple laboratory method: Hepatology, 2010; 52; 249-55
28. Cvirn G, Gallistl S, Leschnik B, Muntean W, Low tissue factor pathway inhibitor (TFPI) together with low antithrombin allows sufficient thrombin generation in neonates: J Thromb Haemost, 2003; 1; 263-68
29. Hasan S, Abuelkasem E, Williams B, Factor IX from prothrombin complex concentrate augments low dose tissue factor-triggered thrombin generation in vitro: Br J Anaesth, 2018; 121; 936-43
30. Al Dieri R, Peyvandi F, Santagostino E, The thrombogram in rare inherited coagulation disorders: Its relation to clinical bleeding: Thromb Haemost, 2002; 88; 576-82
31. Dargaud Y, Béguin S, Lienhart A, Evaluation of thrombin generating capacity in plasma from patients with haemophilia A and B: Thromb Haemost, 2005; 93; 475-80
32. Suzuki A, Suzuki N, Kanematsu T, Clot waveform analysis in Clauss fibrinogen assay contributes to classification of fibrinogen disorders: Thromb Res, 2019; 174; 98-103
33. Baglin T, The measurement and application of thrombin generation: Br J Haematol, 2005; 130; 653-61
34. Gerotziafas GT, Depasse F, Busson J, Towards a standardization of thrombin generation assessment: The influence of tissue factor, platelets and phospholipids concentration on the normal values of Thrombogram-Thrombinoscope assay: Thromb J, 2005; 3; 16
35. Delahousse B, Labat-Debelleix V, Decalonne L, Comparative study of coagulation and thrombin generation in the portal and jugular plasma of patients with cirrhosis: Thromb Haemost, 2010; 104; 741-49
Figures
Figure 1. The effect of isovolemic hemodilution with saline on clot waveform parameters (A), aPTT-dependent clotting factors II, VIII, IX, and X and fibrinogen (B), and thrombin generation profiles (C) measured in undiluted and 10–80% diluted plasma from 11 healthy male volunteers. light blue area indicates the normal range for fibrinogen values. P value <0.05 was considered statistically significant with repeated measures two-way analysis of variance. aPTT – activated partial thromboplastin time; Min1 – minimum value of the first derivative; Min2 – minimum value of the second derivative; Max2 – maximum peaks of the second derivative; ETP – endogenous thrombin potential. Min 1 indicates that the maximum velocity of coagulation is achieved. Min2 describes the index of the maximum acceleration of the reaction. Max2 reflects the maximum deceleration of the reaction. Delta is defined as the total difference in transmittance level. * Statistically significant difference from undiluted plasma. Excel (Version 2207, Microsoft) was used for creation of the figure.Figure 2. The effect of isovolemic hemodilution with saline on thrombin generation potentials. Endogenous thrombin potential (ETP) was measured in undiluted and 10–80% diluted plasma from 11 healthy male volunteers. P<0.05 was considered statistically significant with repeated measures two-way analysis of variance. nM – nanomolar; min – minute; ETPp – procoagulant endogenous thrombin potential; ETPi – inhibitory endogenous thrombin potential. * Statistically significant difference from undiluted plasma. Excel (Version 2207, Microsoft) was used for creation of the figure. Tables
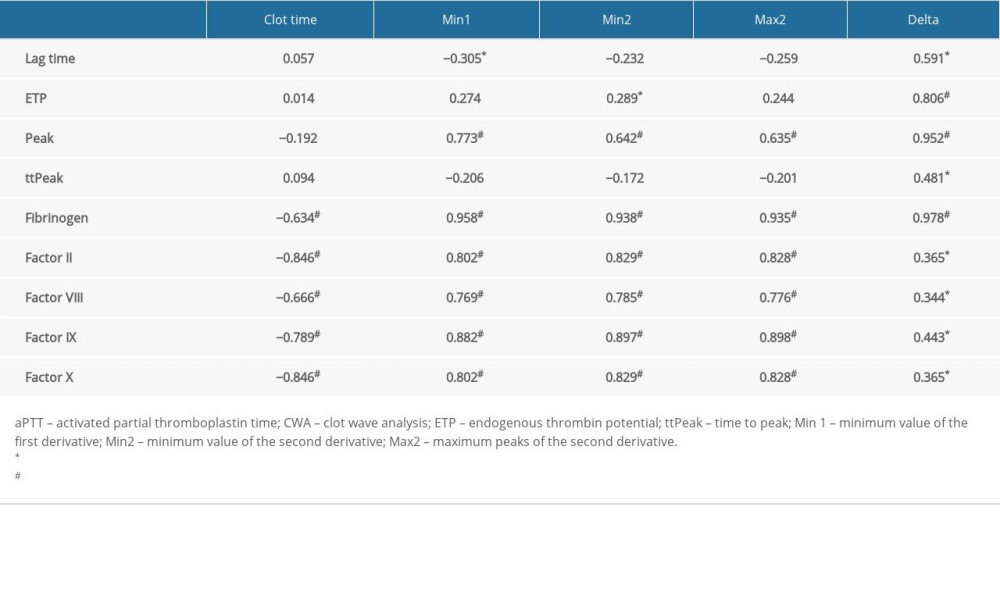 Table 1. The correlation between aPTT-clot waveform analysis variables and thrombin generation parameters, aPTT-dependent coagulation factors, and fibrinogen.Table 1. The correlation between aPTT-clot waveform analysis variables and thrombin generation parameters, aPTT-dependent coagulation factors, and fibrinogen.
 In Press
15 Apr 2024 : Laboratory Research
The Role of Copper-Induced M2 Macrophage Polarization in Protecting Cartilage Matrix in OsteoarthritisMed Sci Monit In Press; DOI: 10.12659/MSM.943738
07 Mar 2024 : Clinical Research
Knowledge of and Attitudes Toward Clinical Trials: A Questionnaire-Based Study of 179 Male Third- and Fourt...Med Sci Monit In Press; DOI: 10.12659/MSM.943468
08 Mar 2024 : Animal Research
Modification of Experimental Model of Necrotizing Enterocolitis (NEC) in Rat Pups by Single Exposure to Hyp...Med Sci Monit In Press; DOI: 10.12659/MSM.943443
18 Apr 2024 : Clinical Research
Comparative Analysis of Open and Closed Sphincterotomy for the Treatment of Chronic Anal Fissure: Safety an...Med Sci Monit In Press; DOI: 10.12659/MSM.944127
Most Viewed Current Articles
17 Jan 2024 : Review article
Vaccination Guidelines for Pregnant Women: Addressing COVID-19 and the Omicron VariantDOI :10.12659/MSM.942799
Med Sci Monit 2024; 30:e942799
14 Dec 2022 : Clinical Research
Prevalence and Variability of Allergen-Specific Immunoglobulin E in Patients with Elevated Tryptase LevelsDOI :10.12659/MSM.937990
Med Sci Monit 2022; 28:e937990
16 May 2023 : Clinical Research
Electrophysiological Testing for an Auditory Processing Disorder and Reading Performance in 54 School Stude...DOI :10.12659/MSM.940387
Med Sci Monit 2023; 29:e940387
01 Jan 2022 : Editorial
Editorial: Current Status of Oral Antiviral Drug Treatments for SARS-CoV-2 Infection in Non-Hospitalized Pa...DOI :10.12659/MSM.935952
Med Sci Monit 2022; 28:e935952