20 December 2020: Animal Study
Effect of Asthma on Erectile Dysfunction in Rats as Determined by Biological Network Analysis
Jisheng Wang 12ABCDEF* , Xuefeng Gong 3ABCDEF* , Sheng Deng 12ABCDEF* , Fanchao Meng 12CDE , Hengheng Dai 12DEF , Binghao Bao 12CD , Junlong Feng 12BF , Haisong Li 2AFG* , Bin Wang 2AFG*DOI: 10.12659/MSM.927491
Med Sci Monit 2020; 26:e927491
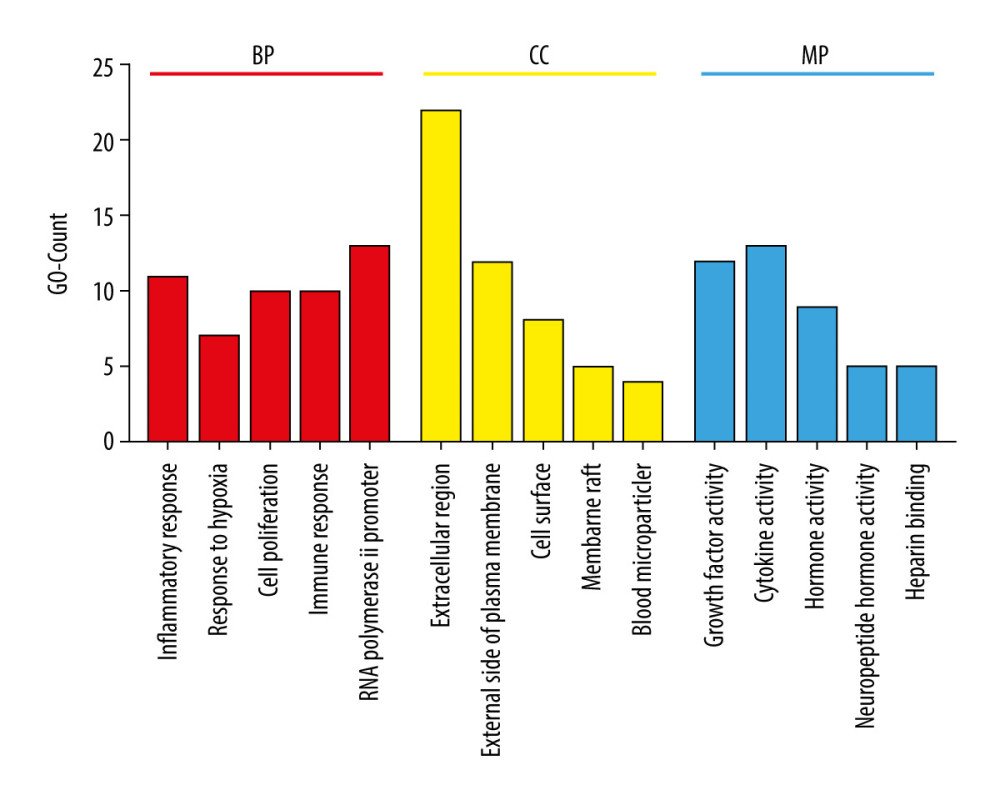
Figure 5 Gene ontology enrichment analysis. The x axis is the top 5 results of biological processes (BP), cell components (CC), and molecular function (MF) P values. The y axis is the number of enriched targets (count). The red bar represents BP, the yellow bar represents CC, and the blue bar represents MF.