15 May 2022: Database Analysis
Bibliometric Visualization Analysis of Microbiome-Gut-Brain Axis from 2004 to 2020
Hui Wang 12* , Tianlin Long 22* , Jing You 22 , Ping Li 232* , Quanhua Xu 22*DOI: 10.12659/MSM.936037
Med Sci Monit 2022; 28:e936037
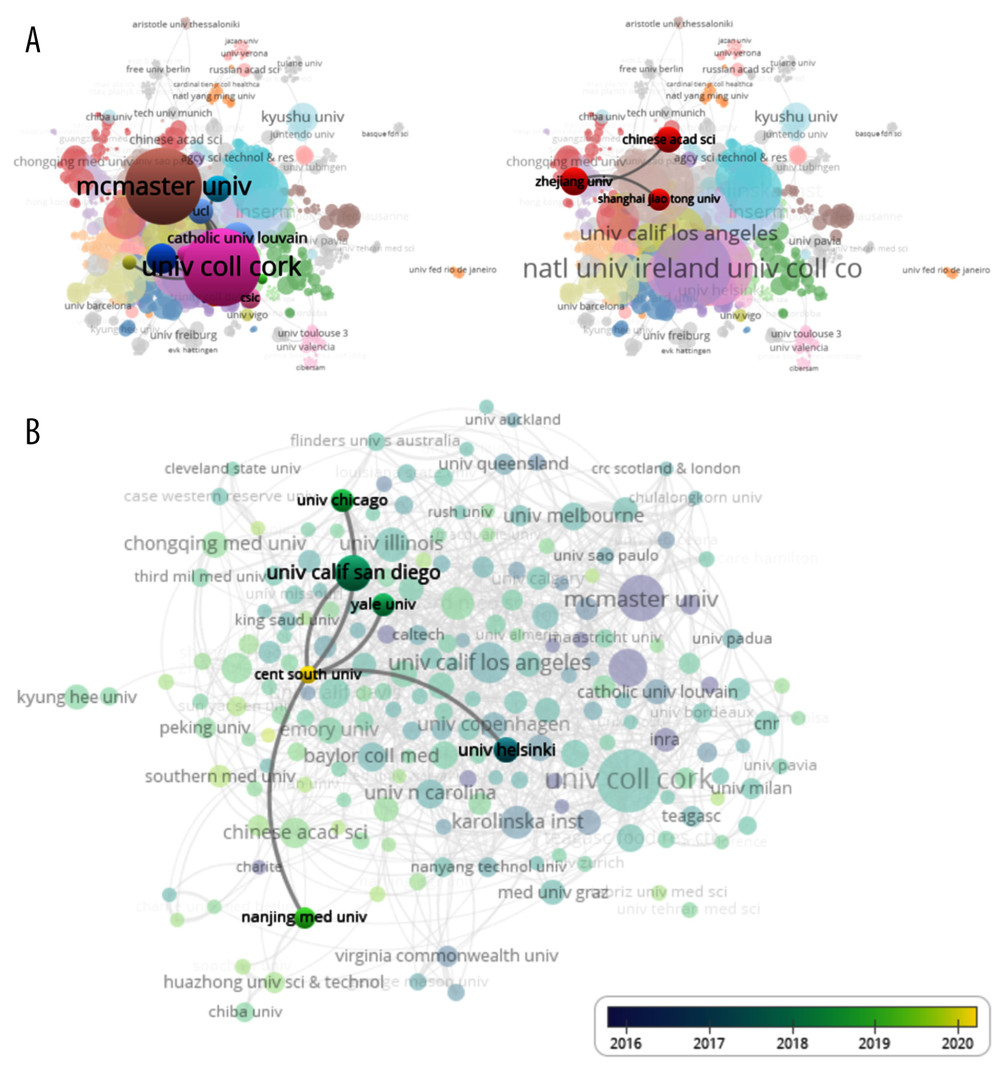
Figure 3 Co-author analysis of organizations. (A) The co-authorship of organizations showed the collaboration of University College Cork and Zhejiang Univ. (B) The average published year showed the recent active organization, Central South University. The color shows the average published year. The network visualization was performed by VOSviewer (1.6.15 versions; Centre for Science and Technology Studies, Leiden University, the Netherlands).