08 May 2024: Clinical Research
Metabolomic Alterations in Methotrexate Treatment of Moderate-to-Severe Psoriasis
Yi Zhou123ACDE, Yantao Ding123BCDE, Mengxing Cui4F, Yuanjing Zhang123BCD, Mengwei Wang32B, Feiran Zhou5F, Yi Su6F, Bo Liang123ACDG*, Fusheng Zhou123ACDDOI: 10.12659/MSM.943360
Med Sci Monit 2024; 30:e943360


Abstract
BACKGROUND: Aberrant lipid metabolism alterations in skin tissue, blood, or urine have been implicated in psoriasis. Here, we examined lipid metabolites related to psoriasis and their association with the age of disease onset.
MATERIAL AND METHODS: Differences in lipid metabolites before and after methotrexate (MTX) treatment were evaluated. The discovery cohort and validation cohort consisted of 50 and 46 patients, respectively, with moderate-to-severe psoriasis. After MTX treatment, the patients were divided into response (Psoriasis Area and Severity Index [PASI] 75 and above) and non-response (PASI below 75) groups, blood was collected for serum metabolomics, and multivariate statistical analysis was performed.
RESULTS: We detected 1546 lipid metabolites. The proportion of the top 3 metabolites was as follows: triglycerides (TG, 34.8%), phospholipids (PE, 14.5%), phosphatidylcholine (PC, 12.4%); diglycerides (DG) (16: 1/18: 1), and DG (18: 1/18: 1) showed strong positive correlations with onset age. There were marked changes in TG (16: 0/18: 0/20: 0), TG (18: 0/18: 0/22: 0), TG (14: 0/18: 0/22: 0), TG (14: 0/20: 0/20: 0), lysophosphatidylcholine (LPC) (16: 0/0: 0), LPC (18: 0/0: 0), LPC (14: 0/0: 0), and LPC (18: 1/0: 0) levels before and after 12 weeks of MTX treatment. The glycerophospholipid metabolic pathway was implicated in psoriasis development. Of the 96 recruited patients, 35% were MTX responders and 65% non-responders. PE (34: 4) and PE (38: 1) levels were significantly different between the groups. Obvious differences in lipid metabolism were found between early-onset (<40 years) and late-onset (≥40 years) psoriasis. Significant changes in serum lipid profile before and after MTX treatment were observed.
CONCLUSIONS: The specific lipid level changes in responders may serve as an index for MTX treatment efficacy evaluation.
Keywords: Lipidomics, Methotrexate, Psoriasis
Introduction
Psoriasis is a common chronic inflammatory skin disease characterized by disruption of epidermal homeostasis and impairment of skin barrier function [1]. Psoriasis is a common health issue worldwide, and approximately 125 million people are affected. The global prevalence of psoriasis varies by geographical location. In general, psoriasis is more common in colder regions than in tropical regions. The prevalence of psoriasis in China is approximately 0.47%, and psoriasis affects individuals of both sexes almost equally [2].
Psoriasis can occur at any age and has a bimodal age at onset (16–22 and 55–60 years). According to the age of onset, psoriasis can be divided into 2 clinical subtypes, early-onset (EOP <40 years) and late-onset (LOP ≥40 years) psoriasis [3]. EOP is generally associated with HLACw6, -B13, and -B57, whereas LOP is correlated with HLA-Cw2 and -B27 [4]. EOP is more serious and likely to relapse than LOP. However, LOP poses a heavier and more rapid inflammatory burden. Cardiovascular diseases, diabetes mellitus, hypertension, and metabolic syndromes are more frequent in LOP than in EOP [5].
Psoriasis is a systemic and life-long disease and is often accompanied by other conditions, such as hyperlipidemia, hypertension, type 2 diabetes, obesity, and cardiovascular complications, which can be categorized as metabolic syndrome. The more severe the psoriasis condition, the higher the risk of the metabolic syndrome. However, the link between them is not clear [6]. In recent years, accumulating evidence has shown that lipid expression and metabolic disorders are more commonly observed in the skin tissue, serum, and urine of patients with psoriasis [7].
The treatment of psoriasis can be roughly divided into 2 categories: topical and systemic. Topical medication mainly refers to local treatment or phototherapy for mild psoriasis, while systemic treatment mainly involves the use of immunosuppressants, such as methotrexate (MTX) and cyclosporine. MTX has been used as a first-line treatment for moderate-to-severe psoriasis for more than 50 years. In recent years, although the discovery and use of biologics have been widely accepted in psoriasis treatment, MTX remains the most commonly used systemic drug for psoriasis globally. MTX acts mainly through the following mechanisms. MTX can (1) reduce DNA synthesis and induce apoptosis of keratin-forming cells; (2) exert immunosuppressive effects through chemotaxis and reduction of adenosine levels, suppressing the production of T and B lymphocytes, pro-inflammatory factors, neutrophils, and monocytes; and (3) exert an anti-inflammatory effect by inhibiting the JAK/STAT pathway at low doses [8]. However, the effectiveness of MTX in the treatment of different types of psoriasis varies. Compared with rich clinical experience, the quality of clinical research on this drug is relatively poor. In our previous study, MTX was more effective and showed fewer adverse effects in patients with psoriasis without arthritis than in those with arthritis [9]. We examined the association between psoriasis susceptibility gene variants and clinical response to MTX and found that patients with psoriasis with the TT genotype rs10036748 in TNIP1 responded better to MTX [10]. These results suggest that the effectiveness of MTX is influenced by multiple factors, such as medical conditions and genetic factors.
Lipidomics refers to the large-scale analysis and characterization of a range of lipid species in biological systems. Considerable changes in lipids, such as lysophosphatidic acid, lysophosphatidylcholine (LPC), phosphatidylinositol, phosphatidylcholine (PC), and phosphatidic acid (PA) are observed in the plasma of patients with psoriasis [11]. This observation suggests that abnormal lipid metabolism may prevail in psoriasis, which has important implications for disease pathogenesis, outcome, and management. Although the lipid component has been implicated in psoriasis development, lipidomic assays are not used to extensively evaluate the efficacy of MTX in the treatment of psoriasis. The aim of this study was to detect alterations in lipid profile in psoriasis after MTX treatment.
Material and Methods
STUDY DESIGN:
From November 2017 to March 2018, 96 patients with psoriasis were recruited from the Outpatient Department of Dermatology. The first batch of samples were from 50 patients and the second batch of samples were from 46 patients.
This study was conducted in accordance with the principles of the World Medical Association Declaration of Helsinki, and the research protocol was approved by the Medical Ethics Committee of the First Affiliated Hospital of Anhui Medical University (PJ2017-11-14). All patients provided informed consent. Only patients over 18 years of age and with moderate-to-severe psoriasis were included in this study. To minimize the confounding factors, we excluded patients with classical phenotypes of hyperlipidemia and hyperglycemia. Patients with psoriasis or arthropathy who received UV radiation, MTX, or other systemic therapy within the first month of the study were excluded. Additionally, topical therapy was discontinued 2 weeks before initiating MTX therapy. European guidelines on contraindications and limitations of MTX use were strictly followed. Psoriasis was assessed by 2 board-certified dermatologists at baseline and after 12 weeks using the Psoriasis Area and Severity Index (PASI) and body surface area scores. Patients were classified as responders if the PASI improved by at least 75% from baseline after 12 weeks of treatment. Non-responders showed a PASI improvement of less than 75%.
LIPID EXTRACTION:
Serum samples were taken from a −80°C freezer and thawed at 4°C. Next, 1 mL of methanol/MTBE (1/3, v/v) and 20 μL of internal lipid standard mix were added to 50 μL of the serum samples. Each sample was vortexed for 3 min and sonicated for 5 min; then, 500 μL of water was added. The supernatant was separated using centrifugation at 12 000 rpm for 10 min at 4°C and concentrated to obtain a powder. The powder was redissolved in 100 μL of a mixture of isopropanol/acetonitrile (1: 1) and analyzed using ultra-performance liquid chromatography-mass chromatography.
CONDITIONS FOR LIQUID CHROMATOGRAPHY-MASS SPECTROMETRY:
The treated sera were analyzed using liquid chromatography on 2.6 μm, 2.1×100 mm Thermo C30 columns (Thermo Scientific, Waltham, MA, USA) using a ultra-performance liquid chromatography system (Shim-pack UFLC CBM30A; Shimadzu, Kyoto, Japan). The eluate was analyzed using mass chromatography (QTRAP 6500; Applied Biosystems, Foster, CA, USA).
Mobile phase A was 0.04% (v/v) acetic acid in water, and mobile phase B was 0.04% (v/v) acetic acid in acetonitrile; the flow rate was 0.35 mL.min−1. Mobile phase gradient conditions were as follows: A/B (80: 20, v/v) 0 min, 70: 30 v/v 2.0 min, 40: 60 v/v 4 min, 15: 85 v/v 9 min, 10: 90 v/v 14 min, 5: 95 v/v 15.5 min, 5: 95 v/v 17.3 min, 80: 20 v/v 17.3 min, and 80: 20 v/v 20 min. The column and autosampler temperatures were maintained at 45°C and 4°C, respectively. The injection volume was 2 μL. Instrument tuning and mass calibration were performed using 10 and 100 μmol·L−1 polypropylene glycol solutions. Scanning detection of ion pairs is based on optimized cluster potential and collision energy. The chemical structures and contents of its metabolites were analyzed using triple quadrupole scanning and multiple reaction monitoring techniques.
QUALITATIVE AND QUANTITATIVE ANALYSES OF METABOLITES:
Qualitative analysis of first and second mass spectrometry data for candidate metabolites was performed using a self-created MetWare database and a public database of metabolite information. To ensure data accuracy, peak-to-peak integration corrections were performed on mass spectra of different samples of the same metabolite. The relative abundance of metabolites was obtained by calculating the peak area of each chromatogram in the mass spectrometry data.
STATISTICAL ANALYSIS:
Owing to the missing values of some samples and metabolites, the following procedure was used to obtain the final dataset: (1) the metabolites with 40% missing values were excluded; (2) the missing values were imputed with the R “mice” package, using the default method “pmm” to predict the mean levels. The differentially expressed metabolites were detected using the R “limma” package, with the multiple linear regression model, “limFit”, with age, sex, and body mass index as covariates. Results with
Results
CLINICAL CHARACTERISTICS OF THE RECRUITED PATIENTS:
A total of 96 samples were analyzed, and the clinical characteristics of the patients from whom the samples were collected, such as demographic analysis of sex, age, body mass index, smoking habit, and alcohol consumption, are shown in Table 1. The first batch samples were from 50 patients with psoriasis (36 male patients, 72.0%) and the second batch samples were from 46 patients with psoriasis (32 male patients, 70.0%).
Detailed information for batch 1 and 2 samples is presented below. The mean age at the time of the survey was 42.7±11.4 and 43.5±12.8 years, respectively, and mean age of initial onset was 30.9±13.4 and 31.1±13.2 years, respectively. The duration of psoriasis was 11.8±9.7 and 12.4±11.5 years, respectively. The mean PASI of these patients with psoriasis was 21.2±14.0 and 12.4±6.8, respectively, at 0 weeks.
After 12 weeks of MTX treatment, 96 patients were divided into 2 groups: MTX responders (35%) and MTX non-responders (65%). In batch 1, 10 (20%) of the 50 patients were responders, whereas 40 (80%) were non-responders. In batch 2, 24 (52%) of the 46 patients were responders, while 22 (48%) were non-responders. There were no significant differences between responders and non-responders in terms of age, sex, body mass index, smoking habit, alcohol consumption, disease progression, PASI score at 0 weeks, and MTX dose. Age of disease onset was higher in responders than in non-responders, although there was no significant difference. However, the 2 groups showed significant differences in PASI scores and PASI improvement at 12 weeks after MTX treatment. Specifically, for the response group, the PASI improvement was 83.8±6.3% in batch 1 and 82.4±6.4% in batch 2, whereas for the non-response group, the PASI improvement was 9.7±34.9% in Batch 1 and 8.0±38.8% in Batch 2 at 12 weeks (Table 1).
LIPIDOMIC ASSAYS IN THE DISCOVERY AND VALIDATION COHORTS:
As shown in the flow chart in Figure 1, 2 lipid assays were used to determine the metabolite levels in the 2 cohorts. The raw lipid levels were detected using liquid chromatography-mass spectrometry and analyzed using SIMCA-P software. As shown in Figure 1A and 1B, 717 lipids (64.8% TG, 15.5% PC, 7% ceramides, and 4% phospholipids (PE)) were detected in assay 1 and 1145 (26.2% TG, 19% PE, 7.5% carnitine, and 5.5% PC) were detected in assay 2. The number of shared lipid metabolites was 316 (26.9% PC, 19.6% TG, 15.8% PE, 9.8% diglycerides (DG), and 9.5% LPC), and that of the total lipids was 1546 (34.8% TG, 14.5% PE, and 12.4% PC) in the 2 assays (Figure 1C, 1D).
LIPID METABOLITES CORRELATED WITH THE AGE OF ONSET:
Owing to the obvious bimodal age of onset for psoriasis, we suspected that lipid metabolites would be altered according to age-related changes (Figure 2). On screening for all metabolites, we found that some lipid metabolites significantly correlated with age of onset. In cohort 1, DG (16: 1/18: 1) and DG (18: 1/18: 1) positively correlated with age of onset: P=2.00E-03, rPearson=0.43 and P=3.25E-03, rPearson=0.41, respectively (Figure 2C). On classifying the patients according to EOP (<40 years) and LOP (≥40 years), we noted that DG (16: 1/18: 1) and DG (18: 1/18: 1) clearly separated EOP and LOP, with area under the receiver operating characteristic curve (AUC) scores of 0.84 and 0.81, respectively. This finding was also verified in cohort 2. DG (16: 1/18: 1) and DG (18: 1/18: 1) positively correlated with the age of onset with P=1.54E-04, rPearson=0.53 and P=8.20E-05, rPearson=0.55 (Figure 2D). The AUC scores were 0.76 and 0.77 for DG (16: 1/18: 1) and DG (18: 1/18: 1) in the distinction between EOP and LOP.
MTX TREATMENT AND METABOLIC ALTERATION:
MTX treatment-induced metabolic alteration has been demonstrated in rheumatic diseases. To elucidate whether MTX treatment induces metabolic alteration in psoriasis, we compared the 1546 metabolic features between 0 and 12 weeks of MTX treatment. Principal component analysis showed remarkable separation between 0 and 12 weeks of MTX treatment in cohort 1 (Figure 3A). At a false discovery rate-adjusted P value of 0.01, we identified 314 differentially expressed targets (Figure 3B). Interestingly, all metabolites were downregulated in the MTX treatment group, with 63.7% being the TG component. Furthermore, the top 3 TG targets were TG (16: 0/18: 0/22: 0) (HMDB0043916, P=9.67E-07), TG (18: 0/18: 0/22: 0) (HMDB0044751, P=1.23E-06), and TG (14: 0/18: 0/22: 0) (HMDB0042156, P=1.23E-06) (Figure 3C). Further pathway analysis revealed that the 139 differentially expressed lipids were enriched in glycerophospholipid (Figure 3D).
METABOLIC ALTERATION IN RESPONDERS AND NON-RESPONDERS OF MTX TREATMENT:
The MTX responders accounted only for 35% of all patients with psoriasis. Whether metabolic alterations led to the efficacy of MTX treatment was clearly demonstrated. Therefore, we performed differential lipid analysis in responders and non-responders. The principal component analysis showed an obvious separation between the groups (Figure 4A). The volcano plot indicated 5 differentially expressed lipids, including 3 upregulated and 2 downregulated targets (Figure 4B). The 3 upregulated lipids consisted of 2 PCs, PC (O-30: 2) (HMDB0013410, P=2.58E-03) and PC (O-36: 1) (HMDB0013427, P=4.46E-03), and a ceramide, ceramide P (d18: 1/16: 0), (HMDB0010700, P=4.78E-03). The 2 downregulated lipids were phosphatidylethanolamine PE (34: 4) (HMDB0008838, P=8.61E-03) and PE (38: 1) (HMDB0008849, P=9.42E-03) (Figure 4C). The pathway analysis showed that these 5 lipid components were highly enriched in glycerophospholipids, and the same pathway was identified on MTX treatment (Figure 4D).
Discussion
The pathogenesis of psoriasis has not been elucidated. Identifying biomarkers for psoriasis diagnosis and treatment response remains a challenge, although some genomic, transcriptomic, proteomic, and metabolomic biomarkers have been identified in the past few decades [12]. More than 20% of patients with psoriasis have a metabolic syndrome, suggesting that aberrant metabolic alterations can provide some clues for disease treatment.
Lipidomics provides a systematic perspective on lipid alterations caused by environmental, genetic, and multiple organ interactions. The lipids associated with psoriasis are primarily found in the stratum corneum, skin surface, and serum, especially TGs or ceramides [7,13,14]. The total cholesterol and TG levels, along with low-density lipoproteins (LDL) and very LDLs, in the blood of patients with psoriasis are significantly higher, whereas high-density lipoprotein concentration is significantly lower than that in healthy individuals [15]. The more severe the psoriasis, the more obvious the abnormal changes in lipid metabolism. It is speculated that high levels of TG are positively associated with an increased risk of psoriasis [14,16]. Moreover, the levels of other lipid metabolites, such as free fatty acids, cholesterol, and PE, were abnormal in the serum of patients with psoriasis per the findings of previous studies.
To evaluate the levels of serum lipids in patients with psoriasis with different phenotypes and the change after MTX treatment, we first characterized the serum lipid profiles of 96 patients with psoriasis and further identified the differentially expressed lipids between EOP and LOP. Some previous studies have shown that EOP and LOP differ in their clinical characteristics and genetic background [5,17,18]. By comparing the serum lipid metabolites in LOP and EOP, we found that the levels of DG (16: 1/18: 1) and DG (18: 1/18: 1) significantly increased in EOP. This is the first attempt to compare lipid metabolism abnormalities between the psoriasis types. In normal human plasma, DGs were also present but at substantially lower levels [19]. DGs are important lipid mediators and can stimulate the activity of protein kinase C, thus acting as membrane second messengers. The activation of DG-signal transduction pathways can regulate
Systemic drugs used in the treatment of psoriasis plaques also affect serum lipid levels. Acitretin can cause hyperlipidemia as an adverse effect. Biological products, such as anti-IL-17A, anti-TNFa, and anti-IL-12/23 antibodies, affect the serum lipid metabolism in patients to different degrees before and after treatment.
MTX has anti-inflammatory, antiproliferation, and immunosuppressive effects and is widely employed as a treatment for inflammatory disorders and autoimmune diseases, such as psoriasis, lupus erythematous, dermatomyositis, and rheumatoid arthritis. However, our understanding of the mechanism of psoriasis treatment with low-dose MTX is limited. The mechanism of action of MTX in the treatment of psoriasis is mainly mediated by activated T-cell death, and highly activated T cells are more susceptible to the cytotoxic effects induced by MTX, which can cause a decrease in the levels of cytokines, such as IL-1, IL-2, IL-4, IL-8, INF-γ, and TNF-α. Some patients with psoriasis respond well to MTX, whereas others respond poorly. Some studies reported that IL10 was significantly increased after 12 weeks of MTX treatment [21]. Therefore, we attempted to analyze the mechanism of action of MTX in psoriasis from the perspective of lipid metabolism. This is the first study to assess the effect of MTX on lipid metabolism in patients with psoriasis, although serum biomarkers have been identified to evaluate the efficacy of MTX treatment in patients with early rheumatoid arthritis [22].
Phospholipids, namely PE, also known as cephalin, accounts for 15% to 25% of the total phospholipids (major components of biomembranes) in cells, and is the second most abundant phospholipid in mammalian cells [23]. PEs are involved in the regulation of cell proliferation, metabolism, organelle function, endocytosis, autophagy, stress responses, apoptosis, and aging [24]. The concentrations of PCs, essential parts of the cell membrane, are low in the serum of patients with psoriasis, and this is mostly related to the higher rate of proliferation of skin cells [25]. LPC is formed by the cleavage of PC and can be divided into saturated and unsaturated LPC according to the acyl chain length and degree of saturation of LPC. An increase or decrease in LPC levels can be observed in different diseases, such as cardiovascular diseases, inflammatory diseases, diabetes, and tumors [26]. LPC (16: 0) and LPC (18: 1) exert pro-inflammatory effects by increasing the release of inflammatory cytokines, such as IL-6 and IL-8 [27]. LPC is the main component of oxidatively damaged LDL, and numerous studies have reported that patients with psoriasis have elevated oxidatively damaged LDL levels. A previous study showed that the lysophosphatidic acid, LPC, and PA levels significantly increase, whereas the phosphatidylinositol and PC levels decreases in the plasma of patients with psoriasis [11].
In the present study, we detected significant changes in serum lipid levels. The levels of TG (16: 0/18: 0/22: 0), TG (18: 0/18: 0/22: 0), and TG (14: 0/18: 0/22: 0) decreased after 12 weeks of MTX treatment. We concluded that MTX can inhibit inflammation and attenuate psoriasis symptoms by reducing TG levels. MTX treatment would alter the composition of serum lipids. A recent study revealed that MTX decreased the levels of pro-atherogenic lipids and the ApoB/ApoA1 ratio in male patients with psoriasis [28]. Meanwhile, genetic variations have been reported to be associated with MTX response. In AnxA6, the rs11960458 CC carriers obtained the lower levels of pro-atherogenic lipids TC, LDL, and ApoB, compared with TC and TT carriers [29], highlighting the genetic predisposition for the MTX treatment mainly through the regulation of lipid metabolites.
Psoriasis is a chronic inflammatory disease, and inflammation can induce a variety of alterations in lipid metabolism. During inflammation and infection, various cytokines are produced, such as TNF, IL-1, and IL-6, which alter the body’s lipid metabolism. In our study, we found that the PC (O-30: 2), PC (O-36: 1), and ceramide P levels increased, while PE (34: 4) and PE (38: 1) levels decreased in MTX responders. The increased serum levels of PC in responders may be related to the decline in the proliferation of skin cells. These changes in PE concentrations may be related to the therapeutic effects of MTX, warranting further in-depth study. This would help us to evaluate the efficacy of MTX, from the perspective of lipid metabolism. For those MTX non-responders, it would be very important to add some blood lipid regulators combined with MTX therapy or use some other immune-suppressant drug.
Some studies have shown that dysregulated metabolic pathways are related to the pathogenesis of psoriasis. Amino acid metabolic activity and glycolysis are upregulated, whereas the fatty acid biosynthesis pathway is downregulated in patients with psoriasis [30]. A study of serum lipid metabolism in 75 patients with psoriasis and 75 healthy controls yielded 44 potential serum biomarkers, which are prominent in the pathways of glycerophospholipid metabolism, sphingolipid metabolism, arachidonic acid metabolism, and bile acid biosynthesis. In patients with psoriasis, the components of glycerophospholipid metabolism are disordered. In the present study, the highly expressed lipids were enriched in glycerophospholipid metabolism.
Our study has certain limitations that warrant consideration. First, we recruited only 96 patients, which is not sufficient to represent the different types of patients. Further studies with a higher number of patients are required to further evaluate the effect of lipids on psoriasis. Second, the dynamics and stability of lipid profiles need to be established for better clinical applications in the future. Third, we only examined changes in lipid profiles in Chinese patients with psoriasis after MTX treatment. It is not clear whether the same changes occur in patients from other ethnicities. Fourth, lipid metabolites would alter according to the individual lifestyles, this detailed information was missed in our study.
Conclusions
We employed serum lipidomics to investigate the potential molecular and physiological mechanisms of MTX treatment in psoriasis. These lipids can be potential targets for psoriasis treatment in the future. Nevertheless, the relationship between these lipid profile alterations and the effect of MTX treatment for psoriasis remains to be investigated.
Figures
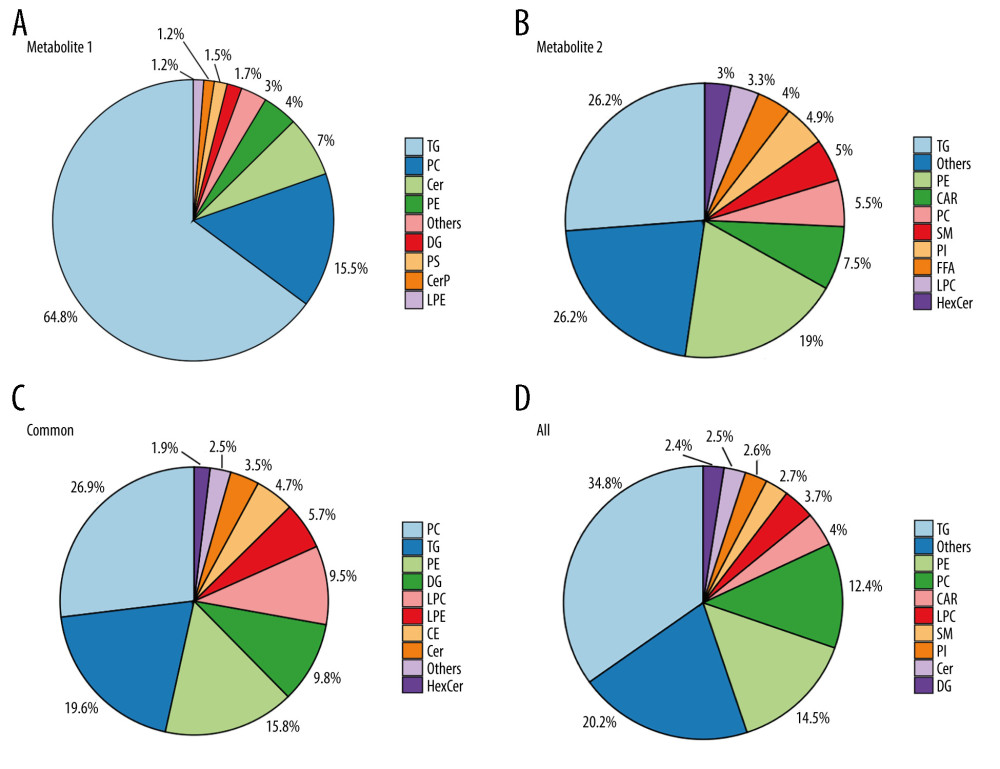 Figure 1. Distribution of lipid metabolites in the 2 assays(A, B) A total of 717 and 1145 lipids were identified in assays 1 and 2, respectively. (C, D). The shared 316 lipid metabolites and a total of 1,546 lipids in the 2 assays are shown in the pie plot. (Figures were generated by R with ggplot2_3.4.2.).
 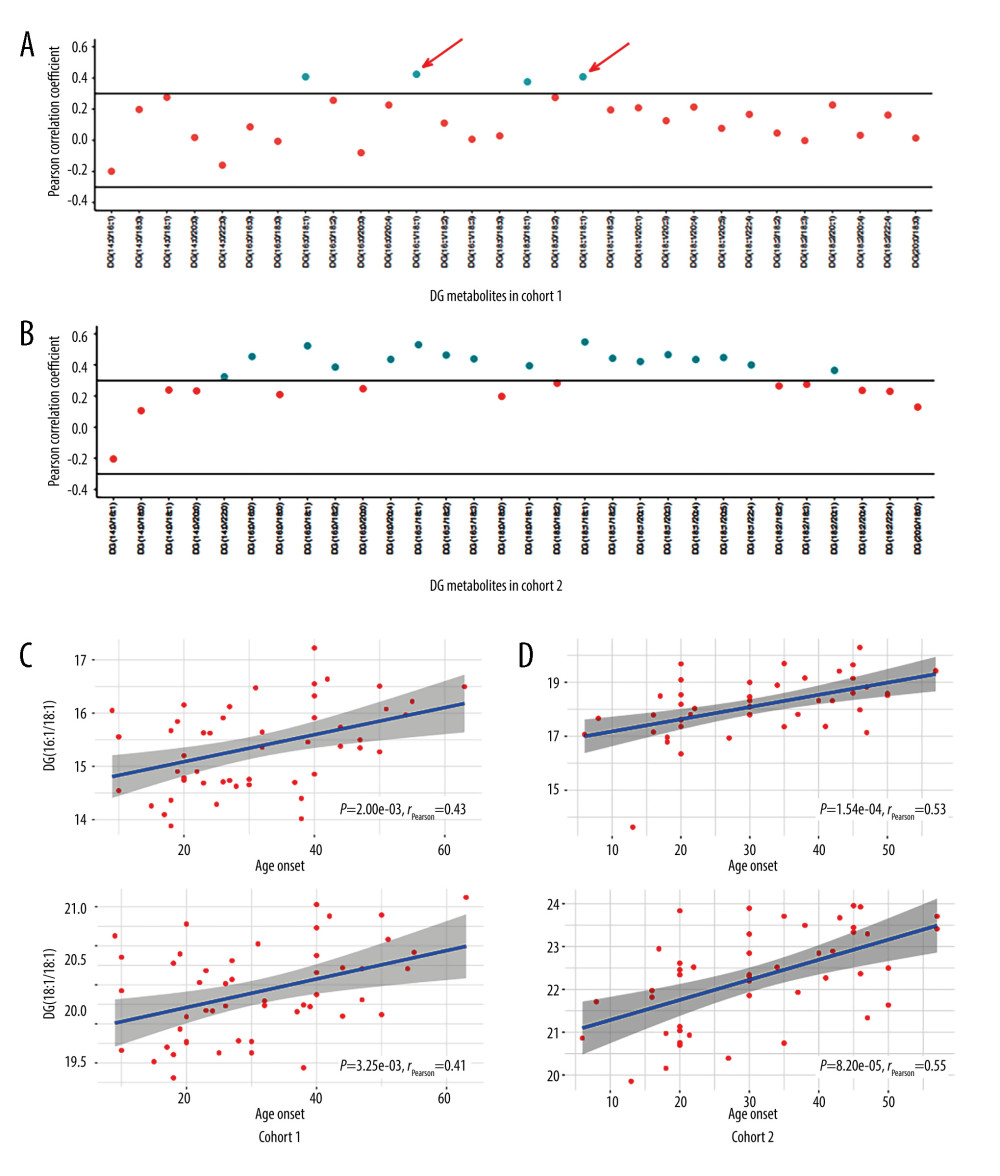 Figure 2. Lipid metabolites correlated with the age of onset in patients with psoriasis(A, B) The distribution of Pearson correlation coefficients for diglyceride (DG) metabolites in cohorts 1 and 2. Each dot represents a DG component. The component with correlation coefficient >0.3 or <−0.3, and correlation P value <0.05 are marked. (C) The change in the level of DG (16: 1/18: 1) and DG (18: 1/18: 1) with the age of onset in cohorts 1. (D) The change in the level of (16: 1/18: 1) and DG (18: 1/18: 1) with the age of onset in cohorts 2. (Figures were generated by R with ggplot2_3.4.2.).
 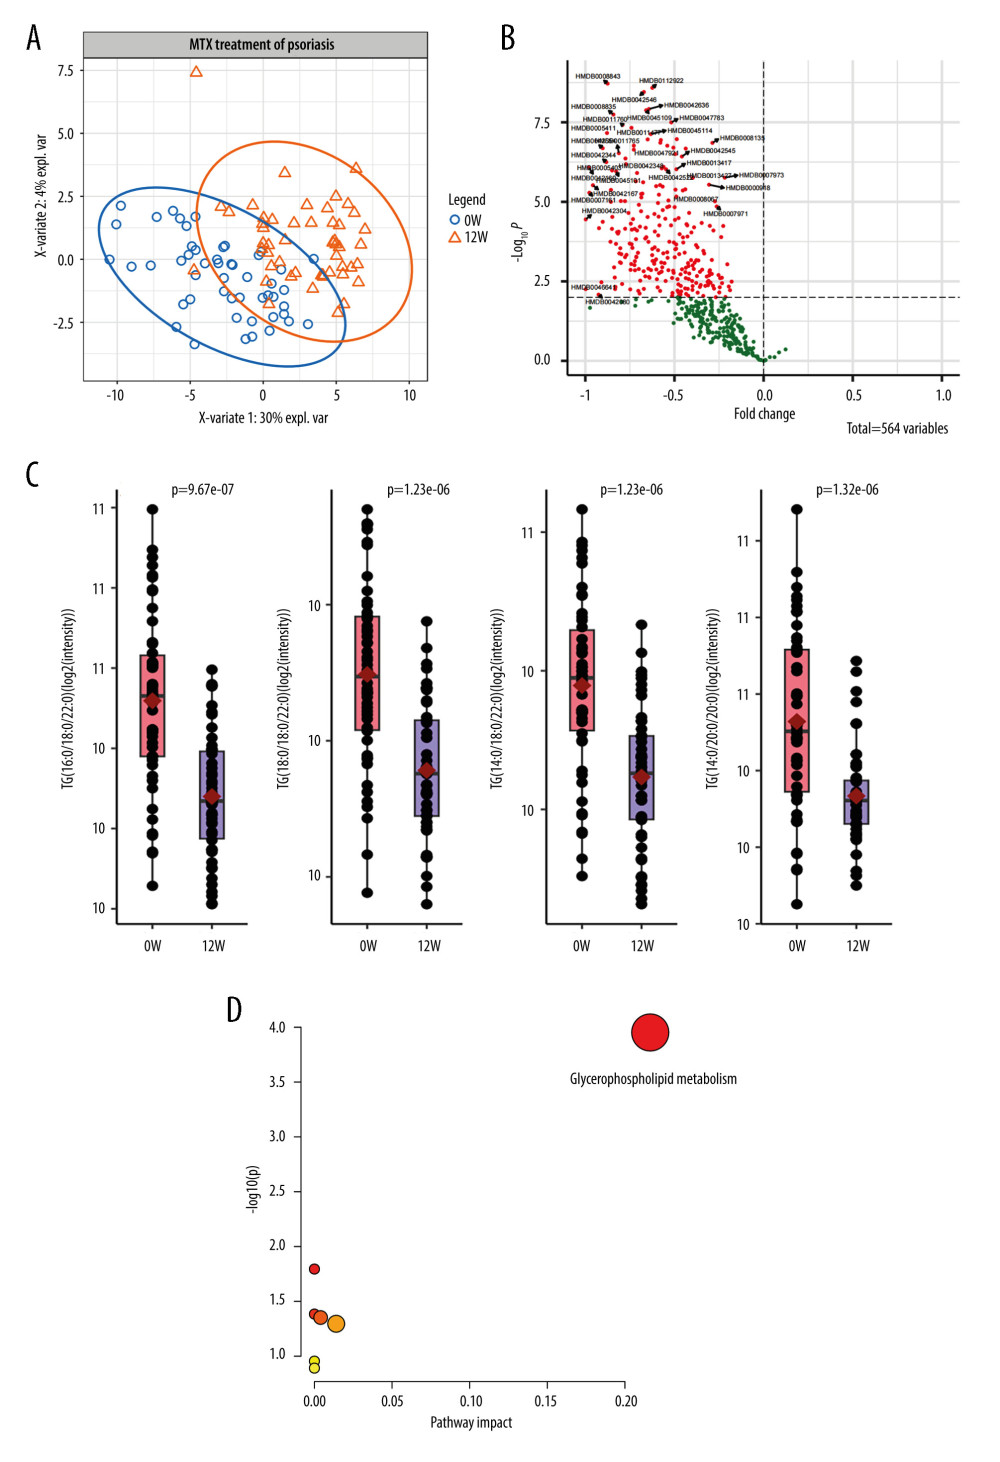 Figure 3. Lipid metabolic alterations in patients with psoriasis after methotrexate (MTX) treatment(A) Principal component analysis plot clearly separating samples from 0 and 12 weeks of MTX treatment in cohort 1. (B) Volcano plot showing 139 differentially expressed metabolites. (C) Three representative lipids were significantly altered after 12 weeks of MTX treatment. Each dot indicates an individual. The 1 quantile and mean and 3 quantile levels are shown in the boxplot. (D) Metabolic pathways showed that the differentially expressed lipids are prominent in the glycerophospholipid pathway. (Figures were generated by R with ggplot2_3.4.2, EnhancedVolcano_1.16.0. The metabolic pathways analysis was based on MetaboAnalyst 6.0.).
 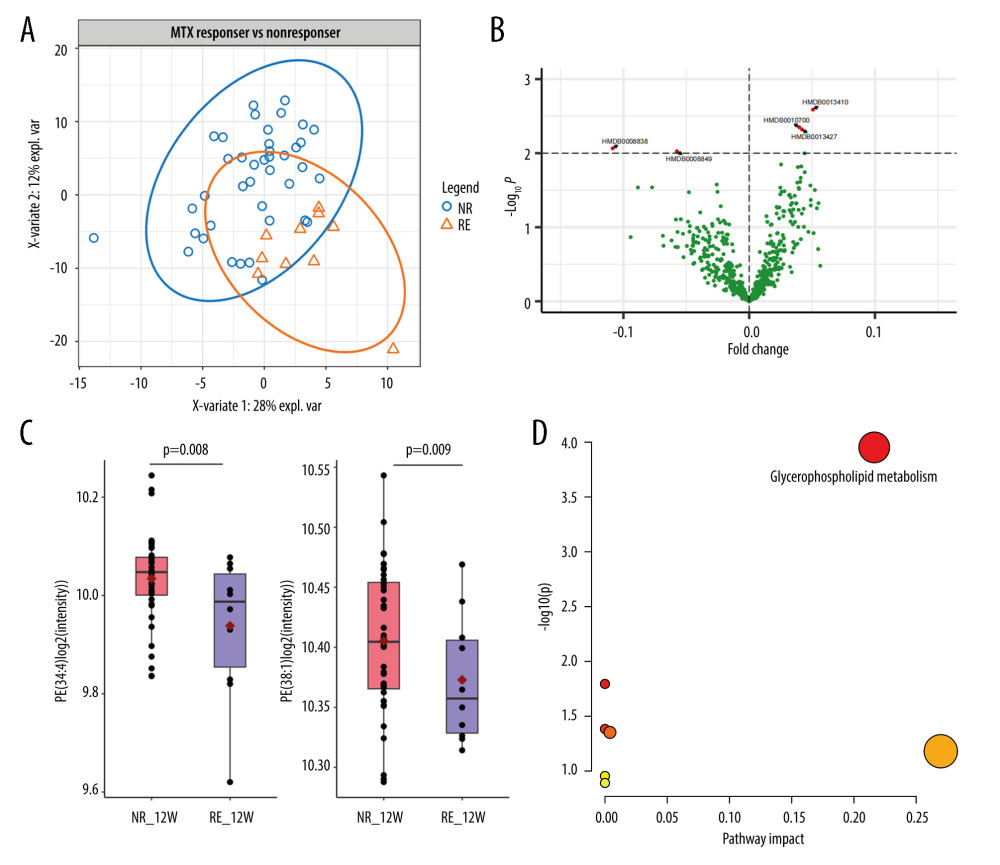 Figure 4. Metabolic alterations among responders and non-responders of methotrexate (MTX) treatment(A) Principal component analysis showed obvious separation between the responders and non-responders. (B) Volcano plot indicates 5 differentially expressed lipids, including 3 upregulated and 2 downregulated targets. (C) Phosphatidylethanolamine PE (34: 4) and PE (38: 1) are downregulated in the responder group. (D) Five lipid components are highly enriched in the glycerophospholipid pathway. (Figures were generated by R with ggplot2_3.4.2, EnhancedVolcano_1.16.0. The Metabolic pathways analysis was based on MetaboAnalyst 6.0.).
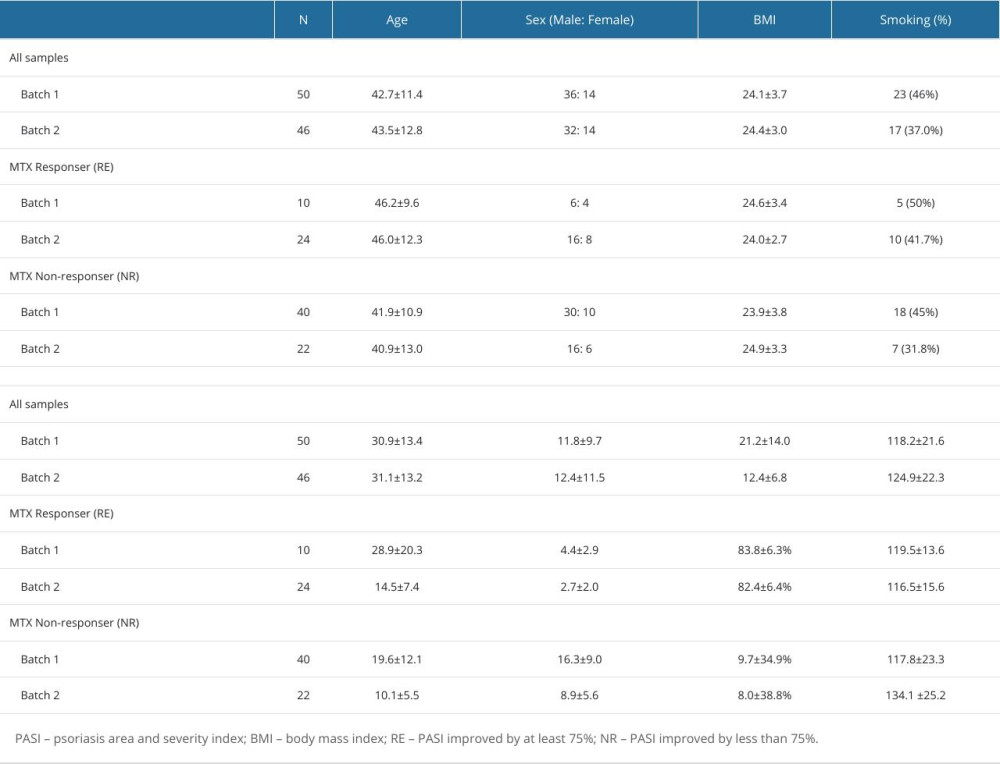
References
1. Roberson ED, Bowcock AM, Psoriasis genetics: Breaking the barrier: Trends Genet, 2010; 26(9); 415-23
2. Ding X, Wang T, Shen Y, Prevalence of psoriasis in China: A population-based study in six cities: Eur J Dermatol, 2012; 22(5); 663-67
3. Griffiths CEM, Armstrong AW, Gudjonsson JE, Barker J, Psoriasis: Lancet, 2021; 397(10281); 1301-15
4. Gupta R, Debbaneh MG, Liao W, Genetic epidemiology of psoriasis: Curr Dermatol Rep, 2014; 3(1); 61-78
5. Huseynova Terzi L, Dogan Gunaydin S, Comparison of early and late onset psoriasis (EOP and LOP) regarding systemic inflammatory comorbidities: LOP is a more rapid subtype of psoriasis: Dermatol Pract Concept, 2022; 12(3); e2022144
6. Hao Y, Zhu YJ, Zou S, Metabolic syndrome and psoriasis: Mechanisms and future directions: Front Immunol, 2021; 12; 711060
7. Nowowiejska J, Baran A, Flisiak I, Aberrations in lipid expression and metabolism in psoriasis: Int J Mol Sci, 2021; 22(12); 6561
8. Alqarni AM, Zeidler MP, How does methotrexate work?: Biochem Soc Trans, 2020; 48(2); 559-67
9. Yan K, Zhang Y, Han L, Safety and efficacy of methotrexate for Chinese adults with psoriasis with and without psoriatic arthritis: JAMA Dermatol, 2019; 155(3); 327-34
10. Yan KX, Zhang YJ, Han L, TT genotype of rs10036748 in TNIP1 shows better response to methotrexate in a Chinese population: A prospective cohort study: Br J Dermatol, 2019; 181(4); 778-85
11. Zeng C, Wen B, Hou G, Lipidomics profiling reveals the role of glycerophospholipid metabolism in psoriasis: Gigascience, 2017; 6(10); 1-11
12. Jiang S, Hinchliffe TE, Wu T, Biomarkers of an autoimmune skin disease – psoriasis: Genomics Proteomics Bioinformatics, 2015; 13(4); 224-33
13. Pietrzak A, Michalak-Stoma A, Chodorowska G, Szepietowski JC, Lipid disturbances in psoriasis: An update: Mediators of inflammation, 2010; 2010; 535612
14. Dreiher J, Weitzman D, Davidovici B, Psoriasis and dyslipidaemia: A population-based study: Acta Derm Venereol, 2008; 88(6); 561-65
15. Pietrzak A, Chabros P, Grywalska E, Serum lipid metabolism in psoriasis and psoriatic arthritis – an update: Arch Med Sci, 2019; 15(2); 369-75
16. Snekvik I, Nilsen TIL, Romundstad PR, Saunes M, Metabolic syndrome and risk of incident psoriasis: Prospective data from the HUNT Study, Norway: Br J Dermatol, 2019; 180(1); 94-99
17. Chularojanamontri L, Kulthanan K, Suthipinittharm P, Clinical differences between early- and late-onset psoriasis in Thai patients: Int J Dermatol, 2015; 54(3); 290-94
18. Zhou Y, Cai M, Sheng Y, Zhang X, A large-scale, stratified genetic analysis of the major histocompatibility complex region in early- and late-onset psoriasis in China: Ann Dermatol, 2021; 33(1); 61-67
19. Quehenberger O, Armando AM, Brown AH, Lipidomics reveals a remarkable diversity of lipids in human plasma: J Lipid Res, 2010; 51(11); 3299-305
20. Sehgal PB, Interleukin-6: Molecular pathophysiology: J Invest Dermatol, 1990; 94(6 Suppl); 2S-6S
21. Owczarczyk-Saczonek A, Drozdowski M, Maciejewska-Radomska A, The effect of subcutaneous methotrexate on markers of metabolic syndrome in psoriatic patients – preliminary report: Postepy Dermatol Alergol, 2018; 35(1); 53-59
22. Wang Z, Chen Z, Yang S, (1)H NMR-based metabolomic analysis for identifying serum biomarkers to evaluate methotrexate treatment in patients with early rheumatoid arthritis: Exp Ther Med, 2012; 4(1); 165-71
23. Vance JE, Phospholipid synthesis and transport in mammalian cells: Traffic (Copenhagen, Denmark), 2015; 16(1); 1-18
24. Patel D, Witt SN, Ethanolamine and phosphatidylethanolamine: Partners in health and disease: Oxid Med Cell Longev, 2017; 2017; 4829180
25. Ottas A, Fishman D, Okas TL, The metabolic analysis of psoriasis identifies the associated metabolites while providing computational models for the monitoring of the disease: Arch Dermatol Res, 2017; 309(7); 519-28
26. Liu P, Zhu W, Chen C, The mechanisms of lysophosphatidylcholine in the development of diseases: Life Sci, 2020; 247; 117443
27. Chang MC, Lee JJ, Chen YJ, Lysophosphatidylcholine induces cytotoxicity/apoptosis and IL-8 production of human endothelial cells: Related mechanisms: Oncotarget, 2017; 8(63); 106177-89
28. Wang B, Deng H, Hu Y, The difference of lipid profiles between psoriasis with arthritis and psoriasis without arthritis and sex-specific downregulation of methotrexate on the apolipoprotein B/apolipoprotein A-1 ratio: Arthritis Res Ther, 2022; 24(1); 17
29. Zhang F, Han L, Wang B, Annexin A6 polymorphism is associated with pro-atherogenic lipid profiles and with the downregulation of methotrexate on anti-atherogenic lipid profiles in psoriasis: J Clin Med, 2022; 11(23); 7059
30. Kang H, Li X, Zhou Q, Exploration of candidate biomarkers for human psoriasis based on gas chromatography-mass spectrometry serum metabolomics: Br J Dermatol, 2017; 176(3); 713-22
Figures
Figure 1. Distribution of lipid metabolites in the 2 assays(A, B) A total of 717 and 1145 lipids were identified in assays 1 and 2, respectively. (C, D). The shared 316 lipid metabolites and a total of 1,546 lipids in the 2 assays are shown in the pie plot. (Figures were generated by R with ggplot2_3.4.2.).Figure 2. Lipid metabolites correlated with the age of onset in patients with psoriasis(A, B) The distribution of Pearson correlation coefficients for diglyceride (DG) metabolites in cohorts 1 and 2. Each dot represents a DG component. The component with correlation coefficient >0.3 or <−0.3, and correlation P value <0.05 are marked. (C) The change in the level of DG (16: 1/18: 1) and DG (18: 1/18: 1) with the age of onset in cohorts 1. (D) The change in the level of (16: 1/18: 1) and DG (18: 1/18: 1) with the age of onset in cohorts 2. (Figures were generated by R with ggplot2_3.4.2.).Figure 3. Lipid metabolic alterations in patients with psoriasis after methotrexate (MTX) treatment(A) Principal component analysis plot clearly separating samples from 0 and 12 weeks of MTX treatment in cohort 1. (B) Volcano plot showing 139 differentially expressed metabolites. (C) Three representative lipids were significantly altered after 12 weeks of MTX treatment. Each dot indicates an individual. The 1 quantile and mean and 3 quantile levels are shown in the boxplot. (D) Metabolic pathways showed that the differentially expressed lipids are prominent in the glycerophospholipid pathway. (Figures were generated by R with ggplot2_3.4.2, EnhancedVolcano_1.16.0. The metabolic pathways analysis was based on MetaboAnalyst 6.0.).Figure 4. Metabolic alterations among responders and non-responders of methotrexate (MTX) treatment(A) Principal component analysis showed obvious separation between the responders and non-responders. (B) Volcano plot indicates 5 differentially expressed lipids, including 3 upregulated and 2 downregulated targets. (C) Phosphatidylethanolamine PE (34: 4) and PE (38: 1) are downregulated in the responder group. (D) Five lipid components are highly enriched in the glycerophospholipid pathway. (Figures were generated by R with ggplot2_3.4.2, EnhancedVolcano_1.16.0. The Metabolic pathways analysis was based on MetaboAnalyst 6.0.). In Press
07 May 2024 : Clinical Research
Treatment of AVN-Induced Proximal Pole Scaphoid Nonunion Using a Fifth and Fourth Extensor Compartmental Ar...Med Sci Monit In Press; DOI: 10.12659/MSM.944553
16 Mar 2024 : Clinical Research
Diagnostic Efficiency of ACR-TIRADS Score for Differentiating Benign and Malignant Thyroid Nodules of Vario...Med Sci Monit In Press; DOI: 10.12659/MSM.943228
08 May 2024 : Clinical Research
Effect of Individualized PEEP Guided by Driving Pressure on Diaphragm Function in Patients Undergoing Lapar...Med Sci Monit In Press; DOI: 10.12659/MSM.944022
21 Mar 2024 : Clinical Research
Impact of Serum Vitamin D, B6, and B12 and Cognitive Functions on Quality of Life in Peri- and Postmenopaus...Med Sci Monit In Press; DOI: 10.12659/MSM.943249
Most Viewed Current Articles
17 Jan 2024 : Review article
Vaccination Guidelines for Pregnant Women: Addressing COVID-19 and the Omicron VariantDOI :10.12659/MSM.942799
Med Sci Monit 2024; 30:e942799
14 Dec 2022 : Clinical Research
Prevalence and Variability of Allergen-Specific Immunoglobulin E in Patients with Elevated Tryptase LevelsDOI :10.12659/MSM.937990
Med Sci Monit 2022; 28:e937990
16 May 2023 : Clinical Research
Electrophysiological Testing for an Auditory Processing Disorder and Reading Performance in 54 School Stude...DOI :10.12659/MSM.940387
Med Sci Monit 2023; 29:e940387
01 Jan 2022 : Editorial
Editorial: Current Status of Oral Antiviral Drug Treatments for SARS-CoV-2 Infection in Non-Hospitalized Pa...DOI :10.12659/MSM.935952
Med Sci Monit 2022; 28:e935952