13 October 2022: Clinical Research
Effects of Hemodilution on Clot Waveform Analysis Parameters, Clotting Factors, and Thrombin Generation Assays in a Dilutional Model Based on Analysis of 11 Healthy Male Blood Donors
Junko Ichikawa ABCDEG* , Ryouta Okazaki BC , Tomoki Fukuda B , Daejoon Yoon B , Makiko Komori DGDOI: 10.12659/MSM.937368
Med Sci Monit 2022; 28:e937368
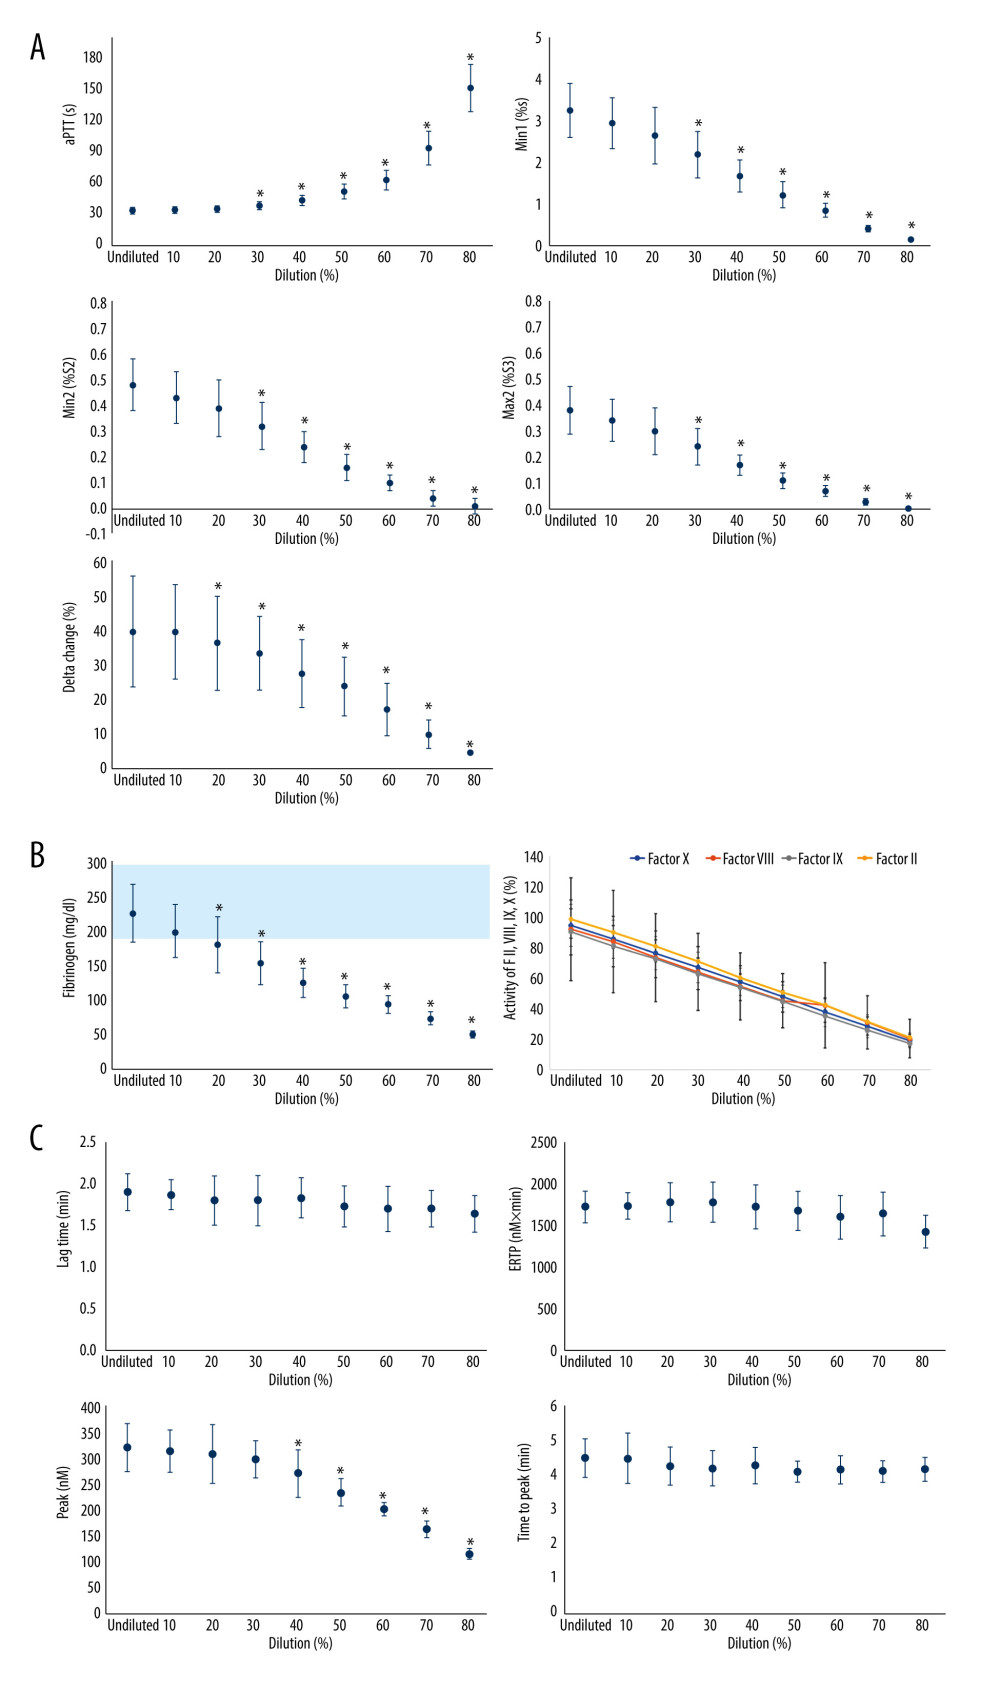
Figure 1 The effect of isovolemic hemodilution with saline on clot waveform parameters (A), aPTT-dependent clotting factors II, VIII, IX, and X and fibrinogen (B), and thrombin generation profiles (C) measured in undiluted and 10–80% diluted plasma from 11 healthy male volunteers. light blue area indicates the normal range for fibrinogen values. P value <0.05 was considered statistically significant with repeated measures two-way analysis of variance. aPTT – activated partial thromboplastin time; Min1 – minimum value of the first derivative; Min2 – minimum value of the second derivative; Max2 – maximum peaks of the second derivative; ETP – endogenous thrombin potential. Min 1 indicates that the maximum velocity of coagulation is achieved. Min2 describes the index of the maximum acceleration of the reaction. Max2 reflects the maximum deceleration of the reaction. Delta is defined as the total difference in transmittance level. * Statistically significant difference from undiluted plasma. Excel (Version 2207, Microsoft) was used for creation of the figure.